The *ABEL suite of R packages and software for genetic analysis has grown substantially since the appearance of GenABEL and the previously mentioned ProbABEL R packages. There are now a handful of useful R packages and other software utilities facilita... [Read more...]
In lattice, there is a function called splom for the display of scatter plot matrices. For large datasets, the panel.hexbinplot from the hexbin package is a better option than the default panel. As an example, let’s use some meteorological data from MAPA-SIAR: library(solaR) library(hexbin) aranjuez [Read more...]
If there is ever a time to learn R and web application development, it is now...in the age of Big Data. The upcoming release of R 2.13 will provide basic functionality for developing R web applications on the desktop via the internal HTTP server, but t... [Read more...]
A couple of quick notes about some upcoming R courses: In Vancouver, Canada, R trainer Isabella Ghement is presenting two R courses: An Introduction to the Statistical Software Package R, 8:30am-4:30pm, March 30-31, 2011, Vancouver, B.C., Canada (http://www.ghement.ca/RworkshopMarch30and31_2011.html) Advanced Statistical Modeling Using the ... [Read more...]
So I have this strange date and time string, which I would like to convert to a “useable” date, i.e., something that a spreadsheet programme or R can work with. It looks like this (MON has 3 chars): ddMONyr:hh:mm:ss The … Continue reading → [Read more...]
Exercise 5.1 Improves the Linear Regression implementation done in Exercise 3 by adding a regularization parameter that reduces the problem of over-fitting.
Over-fitting occurs especially when fitting a high-order polynomial, that we will try to do here.
Data
Here's the points we will make a model from:
# linear regression
mydata = read.csv("... [Read more...]
The housing bubble by city. Miami sailed high and fell far. Detroit rose modestly and but dropped more than it went up. Dallas held steady. DC is enjoying a bit of renewed growth, but are in and New York yet to fall? [Read more...]
Hoy en día, en cualquiera que sea nuestra área de aplicación de la estadística requiere que sepamos programar. Los software convencionales como SPSS y STATA son un tanto limitados, las actualizaciones no son tan constantes y su precio puede ser con... [Read more...]
Thanks to Jim, I’ve been using R in the shell more and more – in concert with vi. It’s been fun, and nice to integrate my workflows all on the server (although I haven’t had to do much graphing yet – I’m sure I’ll start kvetching then ... [Read more...]
Unless you regularly use particular R packages, it’s becomes difficult to stay on top of updates and bug fixes. Updates usually also include significant improvements in performance. I wrote this short snippet of code which I run about once a month to keep up on updates. This short bit ... [Read more...]
Below are some links to a patch against the R-2.12.2 source code that implements a tty connection for R. Since the release of R-2.13.0 is coming soon, I’ll have a patch for it soon also. What’s a tty connection? The tty connection is an R interface to computer ... [Read more...]
I few years ago, while I was working on kernel based density estimation
on compact support distribution (like copulas) I went through a series
of papers on circular distributions. By that time, I thought it was
something for mathematicians working ... [Read more...]
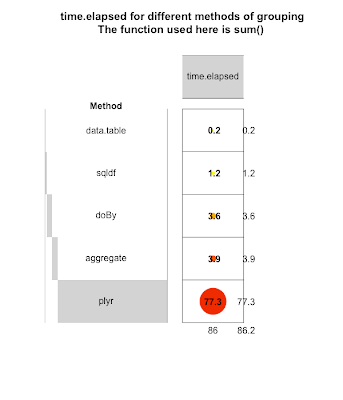
Which one of the sqldf, plyr, doBy and aggregate functions/packages would be faster for applying functions on groups of rows? I was wondering about this earlier in this post. It seems sqldf would be the fastest according to a post in manipulatr m...
Heritage Health and Kaggle have teamed up to create the biggest data science competition thus far: the Heritage Health Prize, which challenges competitors to build a statistical model to predict the number of days a person is likely to spend in hospital over the next year, based on (anonymized) factors ... [Read more...]
I will be attending Ralph Vince's risk-opportunity analysis workshop in Houston this weekend. I'll be in town Friday-Monday. Drop me a note if you're in the area and would like to meet for coffee / drinks.
I have been looking around on the web and have not found anything yet related to using ggplot2 for making graphs/networks. I put together a few functions to make very simple graphs. The bipartite function especially is not ideal, as of course we only w...
While working with some pitch location data recently, I ran across something strange when using my new computer (with R-2.12.2 64-bit) versus my work computer (with R-2.11.1 x64). Both are 64-bit computers, but I got the new one for portability (it's a laptop) and speed.Anyway, I had been doing ... [Read more...]
Introduction Neil Kodner recently got me interested again in analyzing Canabalt scores statistically by writing a great post in which he compared the average scores across iOS devices. Thankfully, Neil’s made his code and data freely available, so I’ve been revising my original analyses using his new data ...