Repost: Bluesky conversation analysis with local and frontier LLMs with R/Tidyverse
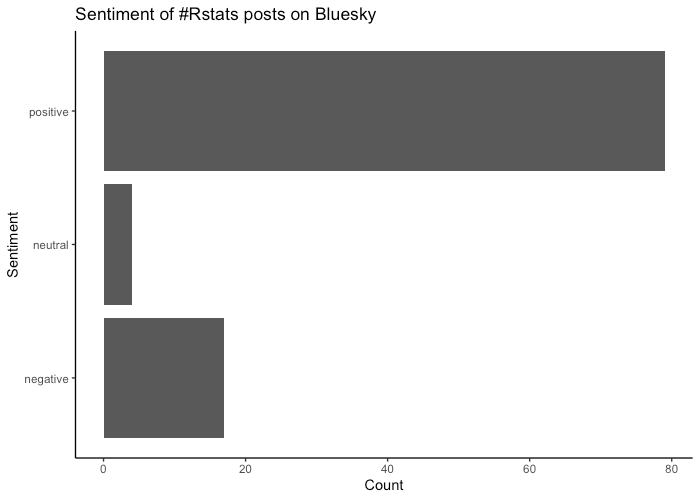
Reposted from the original at https://blog.stephenturner.us/p/bluesky-analysis-claude-llama-tidyverse.Summary, translation, and sentiment analysis of Bluesky posts on a topic using atrrr, tidyverse/ellmer, and mlverse/mall with Claude and ot...