Articles by Simon Jackson

Label line ends in time series with ggplot2

September 25, 2018 | Simon Jackson

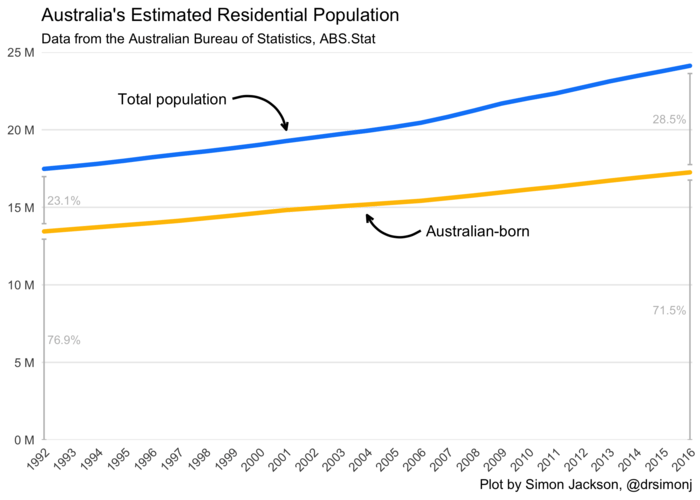
@drsimonj here with a quick share on making great use of the secondary y axis with ggplot2 – super helpful if you’re plotting groups of time series! Here’s an example of what I want to show you how to create (pay attention to the numbers of the ...
[Read more...]

Label line ends in time series with ggplot2

September 25, 2018 | Simon Jackson

@drsimonj here with a quick share on making great use of the secondary y axis with ggplot2 – super helpful if you’re plotting groups of time series! Here’s an example of what I want to show you how to create (pay attention to the numbers of the ...
[Read more...]

Exploring correlations in R with corrr

August 21, 2018 | Simon Jackson

@drsimonj here to share a (sort of) readable version of my presentation at the amst-R-dam meetup on 14 August, 2018: “Exploring correlations in R with corrr”. Those who attended will know that I changed the topic of the talk, originally advertised... [Read more...]

Guide to tidy git analysis

March 26, 2018 | Simon Jackson

@drsimonj here to help you embark on git repo analyses! Ever wondered who contributes to git repos? How their contributions have changed over time? What sort of conventions different authors use in their commit messages? Maybe you were inspired by Mara Averick to contribute to tidyverse packages and wonder how ...
[Read more...]

Creating corporate colour palettes for ggplot2

February 26, 2018 | Simon Jackson

@drsimonj here to share how I create and reuse corporate color palettes for ggplot2. You’ve started work as a data scientist at “drsimonj Inc” (congratulations, by the way) and PR have asked that all your Figures use the corporate colours. They send you the image below (coincidentally the Metro ...
[Read more...]

Five tips to improve your R code

December 30, 2017 | Simon Jackson

@drsimonj here with five simple tricks I find myself sharing all the time with fellow R users to improve their code! This post was originally published on DataCamp’s community as one of their top 10 articles in 2017  1. More fun to sequence from 1 Next time you use the colon operator to ...
[Read more...]

ggplot2 SEM models with tidygraph and ggraph

October 2, 2017 | Simon Jackson

@drsimonj here to share a ggplot2-based function for plotting path analysis/structural equation models (SEM) fitted with Yves Rosseel’s lavaan package.  Background SEM and its related methods (path analysis, confirmatory factor analysis, etc.) can be visualized as Directed Acyclic Graphs with nodes representing variables (observed or latent), and ...
[Read more...]

Big Data Solutions: A/B t test

August 14, 2017 | Simon Jackson

@drsimonj here to share my code for using Welch’s t-test to compare group means using summary statistics.  Motivation I’ve just started working with A/B tests that use big data. Where once I’d whimsically run t.test(), now my data won’t fit into memory! I’m ... [Read more...]

A tidy model pipeline with twidlr and broom

June 1, 2017 | Simon Jackson

@drsimonj here to show you how to go from data in a data.frame to a tidy data.frame of model output by combining twidlr and broom in a single, tidy model pipeline.  The problem Different model functions take different types of inputs (data.frames, matrices, etc) and produce different ...
[Read more...]

Pretty scatter plots with ggplot2

May 15, 2017 | Simon Jackson

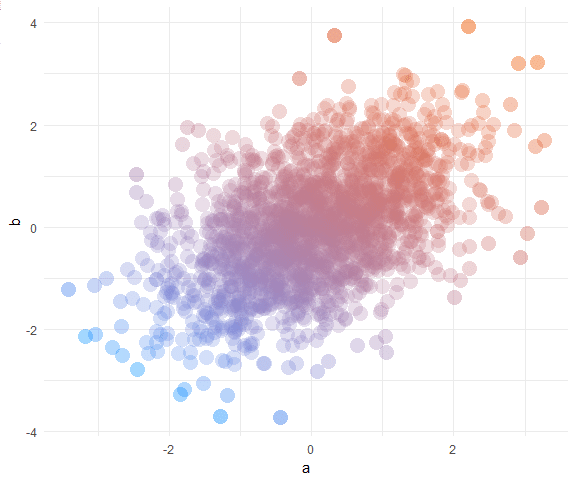
@drsimonj here to make pretty scatter plots of correlated variables with ggplot2! We’ll learn how to create plots that look like this:  Data In a data.frame d, we’ll simulate two correlated variables a and b of length n: set.seed(170513) n 2 0.9133158 0.21116682 #__ 3 1.4516084 0.69060249 #__ 4 0.5264596 0.22471694 #__ 5 -1.9412516 -1.70890512 #__ 6 1.4198574 0.30805526  Basic scatter plot Using ...
[Read more...]

Pretty histograms with ggplot2

May 10, 2017 | Simon Jackson

@drsimonj here to make pretty histograms with ggplot2! In this post you’ll learn how to create histograms like this:  The data Let’s simulate data for a continuous variable x in a data frame d: set.seed(070510) d x #__ 1 1.3681661 #__ 2 -0.0452337 #__ 3 0.0290572 #__ 4 -0.8717429 #__ 5 0.9565475 #__ 6 -0.5521690  Basic Histogram Create the basic ggplot2 histogram ...
[Read more...]

How and when: ridge regression with glmnet

April 10, 2017 | Simon Jackson

@drsimonj here to show you how to conduct ridge regression (linear regression with L2 regularization) in R using the glmnet package, and use simulations to demonstrate its relative advantages over ordinary least squares regression.  Ridge regression Ridge regression uses L2 regularisation to weight/penalise residuals when the parameters of a ...
[Read more...]

Easy leave-one-out cross validation with pipelearner

March 31, 2017 | Simon Jackson

@drsimonj here to show you how to do leave-one-out cross validation using pipelearner.  Leave-one-out cross validation Leave-one-out is a type of cross validation whereby the following is done for each observation in the data: Run model on all other observations Use model to predict value for observation This means that ...
[Read more...]

With our powers combined! xgboost and pipelearner

February 6, 2017 | Simon Jackson

@drsimonj here to show you how to use xgboost (extreme gradient boosting) models in pipelearner.  Why a post on xgboost and pipelearner? xgboost is one of the most powerful machine-learning libraries, so there’s a good reason to use it. pipelearner helps to create machine-learning pipelines that make it easy ...
[Read more...]

Tidy grid search with pipelearner

February 1, 2017 | Simon Jackson

@drsimonj here to show you how to use pipelearner to easily grid-search hyperparameters for a model. pipelearner is a package for making machine learning piplines and is currently available to install from GitHub by running the following: # install.packages("devtools") # Run this if devtools isn't installed devtools::install_github("drsimonj/... [Read more...]
1 2 3

Never miss an update!
Subscribe to R-bloggers to receive
e-mails with the latest R posts.
(You will not see this message again.)

Click here to close (This popup will not appear again)