Articles by Simon Jackson

Grid search in the tidyverse

December 10, 2016 | Simon Jackson

@drsimonj here to share a tidyverse method of grid search for optimizing a model’s hyperparameters.  Grid Search 
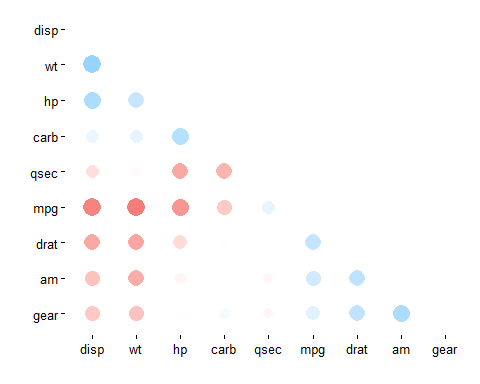
For anyone who’s unfamiliar with the term, grid search involves running a model many times with combinations of various hyperparameters. The point is to identify which hyperparameters are likely to work ...
[Read more...]

k-fold cross validation with modelr and broom

December 3, 2016 | Simon Jackson

@drsimonj here to discuss how to conduct k-fold cross validation, with an emphasis on evaluating models supported by David Robinson’s broom package. Full credit also goes to David, as this is a slightly more detailed version of his past post, which I read some time ago and felt like ...
[Read more...]

Plotting my trips with ubeR

November 27, 2016 | Simon Jackson

@drsimonj here to explain how I used ubeR, an R package for the Uber API, to create this map of my trips over the last couple of years:  Getting ubeR The ubeR package, which I first heard about here, is currently available on GitHub. In R, install and load it ...
[Read more...]

Ordering categories within ggplot2 facets

November 12, 2016 | Simon Jackson

@drsimonj here to share my method for ordering categories within facets to create plots that look like this… instead of like this…  Motivation: Tidy Text Mining in R The motivation for this post comes from Tidy Text Mining in R by Julia Silge and David Robinson. It is a must ...
[Read more...]

corrr 0.2.1 now on CRAN

October 11, 2016 | Simon Jackson

@drsimonj here to discuss the latest CRAN release of corrr (0.2.1), a package for exploring correlations in a tidy R framework. This post will describe corrr features added since version 0.1.0. You can install or update to this latest version directly from CRAN by running: install.packages(corrr) Let’s load corrr ...
[Read more...]

ourworldindata: an R data package

October 6, 2016 | Simon Jackson

@drsimonj here to introduce ourworldindata: a new data package for R. The ourworldindata package contains data frames that are generated by combining datasets from OurWorldInData.org: “an online publication that shows how living conditions around the world are changing”. The data frames in this package have undergone tidying so that ...
[Read more...]

Running a model on separate groups

September 19, 2016 | Simon Jackson

Ever wanted to run a model on separate groups of data? Read on! Here’s an example of a regression model fitted to separate groups: predicting a car’s Miles per Gallon with various attributes, but spearately for automatic and manual cars. library(tidyverse) library(broom) mtcars %__% nest(-am) %__% mutate(...
[Read more...]

Five ways to calculate internal consistency

August 26, 2016 | Simon Jackson

Let’s get psychometric and learn a range of ways to compute the internal consistency of a test or questionnaire in R. We’ll be covering: Average inter-item correlation Average item-total correlation Cronbach’s alpha Split-half reliability (adjusted using the Spearman–Brown prophecy formula) Composite reliability If you’re unfamiliar ...
[Read more...]

Visualising Residuals

August 23, 2016 | Simon Jackson

Residuals. Now there’s something to get you out of bed in the morning! OK, maybe residuals aren’t the sexiest topic in the world. Still, they’re an essential element and means for identifying potential problems of any statistical model. For example, the residuals from a linear regression model ...
[Read more...]

focus() on correlations of some variables with many others

August 10, 2016 | Simon Jackson

Get the correlations of one or more variables with many others using focus() from the corrr package: library(corrr) mtcars %__% correlate() %__% focus(mpg) #__ # A tibble: 10 x 2 #__ rowname mpg #__ #__ 1 cyl -0.8521620 #__ 2 disp -0.8475514 #__ 3 hp -0.7761684 #__ 4 drat 0.6811719 #__ 5 wt -0.8676594 #__ 6 qsec 0.4186840 #__ 7 vs 0.6640389 #__ 8 am 0.5998324 #__ 9 gear 0.4802848 #__ 10 carb -0.5509251 Let’s break it down.  Motivation I’...
[Read more...]

fashion() output with corrr

August 3, 2016 | Simon Jackson

Tired of trying to get your data to print right or formatting it in a program like excel? Try out fashion() from the corrr package: d gender age height fte #__ 1 Male NA 188.0000 NA #__ 2 Female 28.11111 NA 0.78273 #__ 3 74.30000 168.7891 0.90000 library(corrr) fashion(d) #__ gender age height fte #__ 1 Male 188.00 #__ 2 Female 28.11 .78 #__ 3 74.30 168.79 .90 But how does it work ... [Read more...]

Correlation network_plot() with corrr

July 28, 2016 | Simon Jackson

Looking for patterns or clusters in your correlation matrix? Spot them quickly using network_plot() in the latest development version of the corrr package! # Install the development version of corrr install.packages("devtools") devtools::install_github("drsimonj/corrr") library(corrr) airquality %__% correlate() %__% network_plot(min_cor = .1) From this, we can ...
[Read more...]

Line plot for two-way designs using ggplot2

July 24, 2016 | Simon Jackson

Want to use R to plot the means and compare differences between groups, but don’t know where to start? This post is for you. As usual, let’s start with a finished example: library(dplyr) library(ggplot2) pd % mutate(cyl = factor(cyl), am = factor(am, labels = c("automatic", "manual"))) %__% ...
[Read more...]

rearrange() your correlations with corrr

July 20, 2016 | Simon Jackson

Don’t stare at your correlations in search of variable clusters when you can rearrange() them: library(corrr) mtcars %__% correlate() %__% rearrange() %__% fashion() #__ rowname am gear drat wt disp mpg cyl vs hp carb qsec #__ 1 am .79 .71 -.69 -.59 .60 -.52 .17 -.24 .06 -.23 #__ 2 gear .79 .70 -.58 -.56 .48 -.49 .21 -.13 .27 -.21 #__ 3 drat .71 .70 -.71 -.71 .68 -.70 .44 ...
[Read more...]

Quick plot of all variables

July 15, 2016 | Simon Jackson

This post will explain a data pipeline for plotting all (or selected types) of the variables in a data frame in a facetted plot. The goal is to be able to glean useful information about the distributions of each variable, without having to view one at a time and keep ...
[Read more...]

Explore correlations in R with corrr

July 13, 2016 | Simon Jackson

Earlier this week, my first package, corrr, was made available on CRAN. Below are the introductory instructions provided on the README for this first-release version 0.1.0. Please contribute to corrr on Github or email me your suggestions!  corrr corrr is a package for exploring correlations in R. It makes it possible ...
[Read more...]
1 2 3

Never miss an update!
Subscribe to R-bloggers to receive
e-mails with the latest R posts.
(You will not see this message again.)

Click here to close (This popup will not appear again)