Posterior predictive sampling and other post-MCMC use of samples in NIMBLE
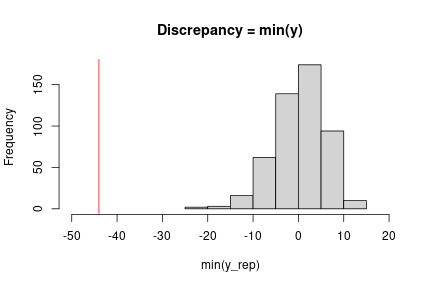
(Prepared by Chris Paciorek and Sally Paganin.) Once one has samples from an MCMC, one often wants to do some post hoc manipulation of the samples. An important example is posterior predictive sampling, which is needed for posterior predictive checking. With posterior predictive sampling, we need to simulate new data ...