2020

Undersampling Will Change the Base Rates of Your Model’s Predictions

November 22, 2020 | rstats on Bryan Shalloway's Blog

Create Data 
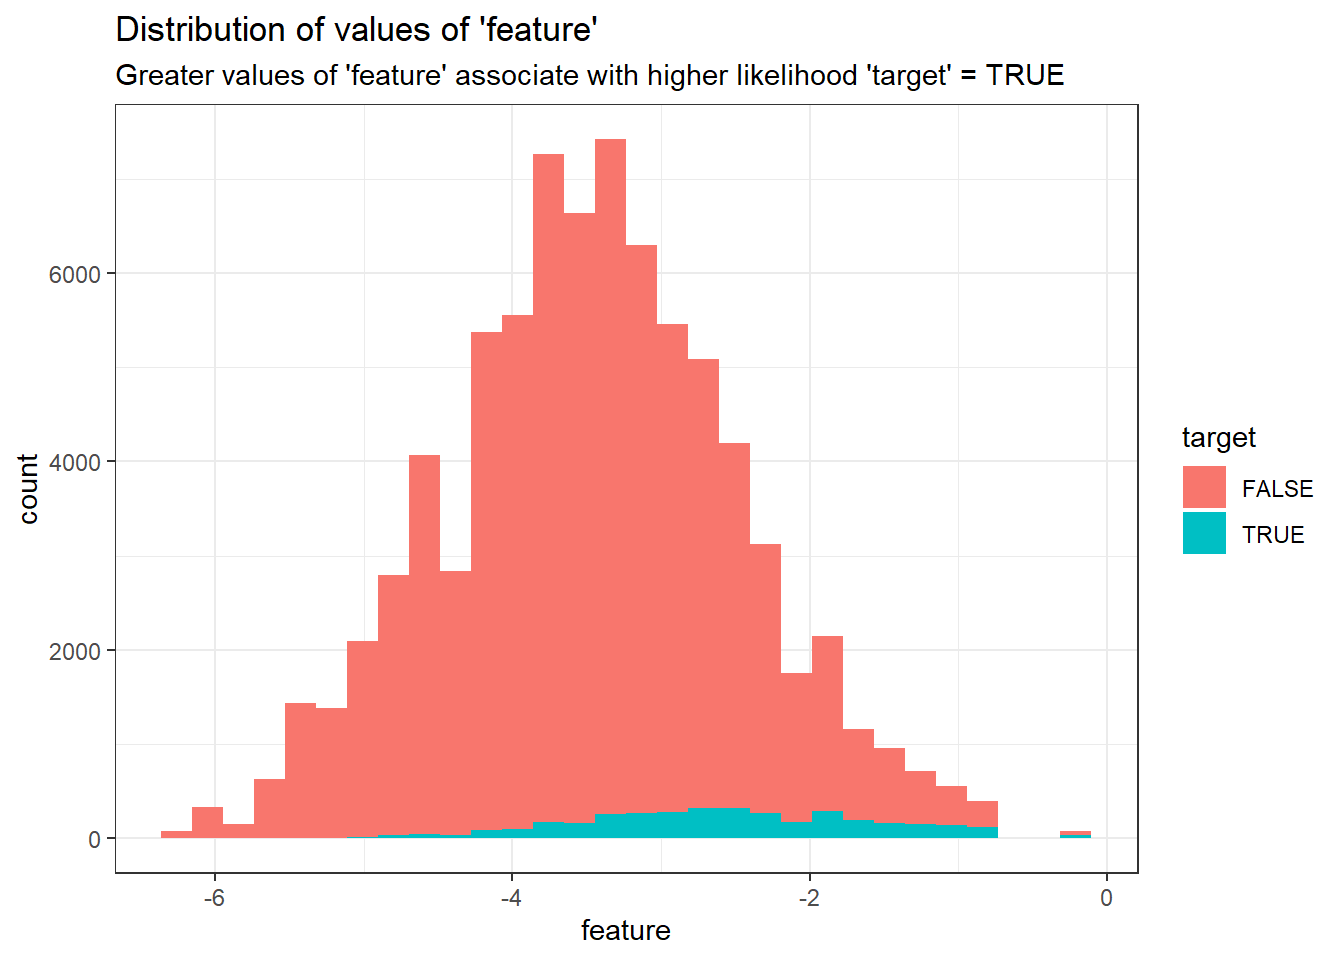
Association of ‘feature’ and ‘target’ Resample Build Models Rescale Predictions to Predicted Probabilities Appendix Density Plots Lift Plot TLDR: In classification problems, under and over sampling1 techniques shift the distribution of predicted probabilities towards the minority class. If your problem requires accurate probabilities you will need to adjust ...
[Read more...]

Online Tests for TestVision with R/exams

November 22, 2020 | R/exams

Generating, importing, and customizing online tests for TestVision with R/exams. Motivation This tutorial illustrates how to use R/exams for creating online exams for TestVision. Testvision is a Dutch commercial onlin...
[Read more...]

Online Tests for TestVision with R/exams

November 22, 2020 | R/exams

Generating, importing, and customizing online tests for TestVision with R/exams. Motivation This tutorial illustrates how to use R/exams for creating online exams for TestVision. Testvision is a Dutch commercial onlin... [Read more...]

Bio7 3.2 Released

November 20, 2020 | Marcel Austenfeld

20.11.2020 A new version of Bio7 is available. This update comes with a plethora of new features, improvements and bugfixes. For those who don’t know Bio7. The application Bio7 is an integrated development environment for ecological modeling, scientific image analysis and statistical analysis. It also contains a feature complete development ...
[Read more...]

Lake Erie Pileup

November 19, 2020 | AdventuresInData

 Strong winds caused substantial water surface elevation differences in Lake Erie around November 15, 2020.  Here's an animated plot of elevations measured by NOAA.  Plot was developed using R and Windows Live Movie Maker [Read more...]

Lake Erie Pileup

November 19, 2020 | AdventuresInData

 Strong winds caused substantial water surface elevation differences in Lake Erie around November 15, 2020.  Here's an animated plot of elevations measured by NOAA.  Plot was developed using R and Windows Live Movie Maker [Read more...]
1 18 19 20 21 22 165

Never miss an update!
Subscribe to R-bloggers to receive
e-mails with the latest R posts.
(You will not see this message again.)

Click here to close (This popup will not appear again)