
RObservations #40 : Packaging My Route Map Code! Introducting mapBliss.
Want to share your content on R-bloggers? click here if you have a blog, or here if you don't.
Introduction
Around last year I started blogging about Atlas.co and how its possible to imitate their product in R with a some readily available packages and the MapBox API. Recently I managed to take some time and refine and organize the code I had to make the package I call mapBliss.
I’m really happy with the package so far because it pretty much offers almost all the features for making the type of maps that you can find on Atlas.co and similar sites. In this blog I share some of the features available, basic usage and potential next steps for the development of the mapBliss package.
Features
The mapBliss package allows users to to use their custom made MapBox templates and plot car, bike, walking and flight trips over them. It is also possible to get a city view without any trip plotted as well.
As of the time of this blog, there are are five functions. Four of them are used for plotting maps and one of them is used for rendering the maps created as .svg files.
The functions created are:
-
plot_route()– for plotting car, bike and walking trips. -
plot_flights()– for plotting flights. -
plot_hybrid_route()– for plotting a combination of flights and car, bike and walking trips. -
plot_city_view()– for plotting city maps. -
save_map_svg()– for saving the maps you created as print quality .svg files.
Basic Usage
I structured these functions so that they are pretty straight forward to use while allowing for some flexibility with styling. To get started with basic usage, all that’s needed is for you to supply the relevant locations for the plot functions and a file name for when you want to save your visuals with save_map_svg().
Since I wrote about in previous blogs for how to plot routes and flight paths and the usage for those functions have not changed significantly, I will not write about them here. The plot_city_view() function is also pretty straight forward, so for a use case example I’ll use what I think is the most novel function – plot_hybrid_route().
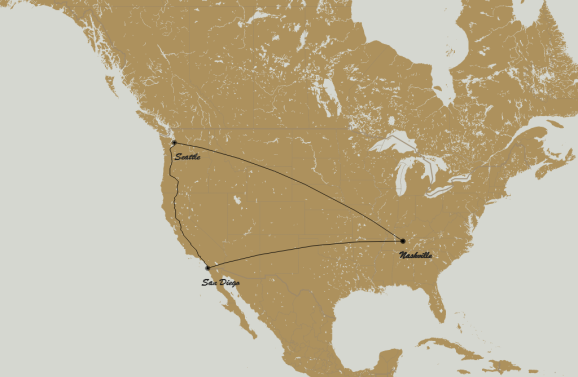
Suppose you are interested in plotting a flight from Nashville TN, to Seattle, followed by a road trip down to the San Diego ending with a return flight to Nashville. The code to do this is:
# devtools::install_github("benyamindsmith/mapBliss")

library(mapBliss)

plot_hybrid_route(addresses=c("Nashville",
                              "Seattle",
                              "San Diego",
                              "Nashville"),
                            how = c("flight","car","flight"))

This is pretty good. But the default templating doesn’t look the greatest. With a custom MapBox template you can make it look alot better! To learn how to make your own custom MapBox template check out this video here:
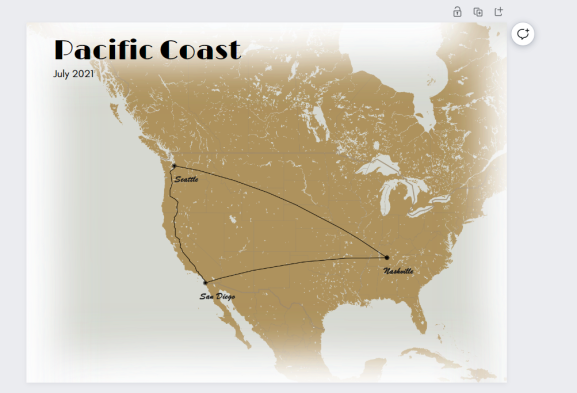
With this as well as playing around with some of the default arguments in plot_hybrid_route() we can get quite a nice looking map:
viz<-plot_hybrid_route(addresses=c("Nashville",
                              "Seattle",
                              "San Diego",
                              "Nashville"),
                            how = c("flight","car","flight"),
                  font="Brush Script MT",
                  font_size = "18px",
                  text_indent = "45px",
                  mapBoxTemplate = "https://api.mapbox.com/styles/v1/benyamindsmith/ckv64zmgy1awy14ofg33zmszz/tiles/{z}/{x}/{y}?access_token=pk.eyJ1IjoiYmVueWFtaW5kc21pdGgiLCJhIjoiY2tiMDR3NXpzMDU3bjJ1cXVqNmx3ODhudyJ9.KffbwvHgcIn1GL1DV4uUBQ",
                  zoomControl = c(10, 10, -10, -10)
                  )

viz
Now that we have a beautiful map, if we want to save the visual as an .svg file for printing of all size we can use the save_map_svg() function. Take your saved image to your favorite online printer and enjoy art that would’ve costed you up to $250.00 USD + shipping for a fraction of price.
save_map_svg(viz=viz,
             svg_name = "Pacific Highway 2021.svg",
             zoom=3)


## [1] "Pacific Highway 2021.svg written in F:/"
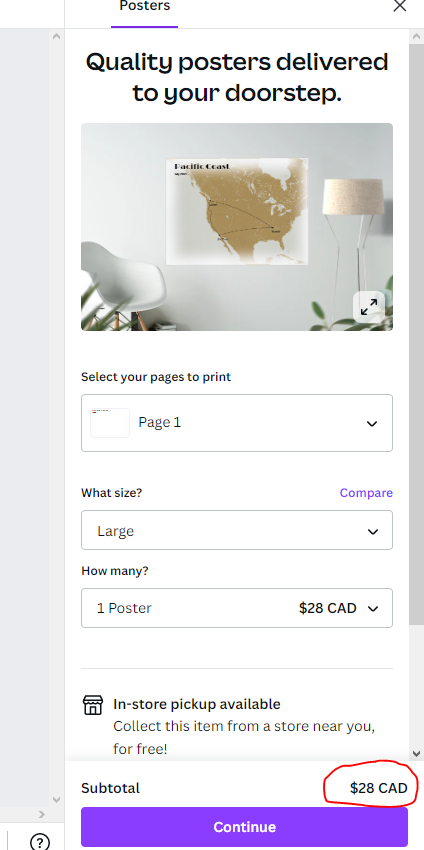
Taking this to Canva and playing around with some templating I was able to design this poster with minimal effort.
And the cost to order this as a poster is much cheaper.
Dependencies
It goes without saying that mapBliss was built with many of the pre-existing packages on CRAN. They are (to date):
Thank you to all the authors and maintainers of these packages whom made it possible for this package to come into existence.
Next Steps
This package is pretty good for making artistic maps, but there are some features which are presently lacking that I would be nice to have:
- Better package documentation. The package documentation is complete, however I’m sure there is room to improve it.
- Template design. Right now maps which are created with mapBliss are just html widgets that are screenshoted and converted to .svg files. The next step would be having the ability to take these .svg files and place them in a frame template that would allow for the user to put a title and text similar to whats available on Atlas.co.
- A GUI. Presently, the features in mapBliss are only available to the R-saavy. It would be cool to make this tool available to the general public. A intuitive approach would be to build a Shiny app, but, as expected, this takes alot of work and time investment. For a front end application, some alterations in the package code will likely need to be implemented so as to allow users to freely change and alter the maps they create like how it is done on Atlas.co.
Share your Maps!
One of the wonderful things about putting this package in the open is enabling other R users to create their own beautiful maps of their journeys. With the MapBox API, number of possible templates and designs are endless. I have only made a few (which can be viewed on Github). If you do use this package and make a map. Please post in the comments of this blog the link to the visual you made!
Conclusion
mapBliss in its present form is pretty much ready for submission to CRAN. I haven’t done it yet because its presently not a priority. For now, I am really happy with the progress I have made with this package and am happy with the form it is in now.
If you have any other ideas of what you would possibly want, feel free to open a Github issue on the repository and let me know!
Let me know what you think of the mapBliss package! Thank you for reading!

Want to see more of my content?
Be sure to subscribe and never miss an update!
R-bloggers.com offers daily e-mail updates about R news and tutorials about learning R and many other topics. Click here if you're looking to post or find an R/data-science job.
Want to share your content on R-bloggers? click here if you have a blog, or here if you don't.