September 2020

Predicting pneumonia outcomes: Modelling via DataRobot API

September 11, 2020 | R on notast

This post is a supplementary material for an assignment. The assignment is part of the Augmented Machine Learning unit for a Specialised Diploma in Data Science for Business. The aim of this project is to classify if patients with Community Acquired Pneumonia (CAP) became better after seeing a doctor or ...
[Read more...]

Updated Shiny App

September 10, 2020 | rstats-tips.net

Today I’ve updated my Shiny App I wrote about a few days ago. I’m using now Flexdashboard to embed a shiny app into an Rmarkdown-File. Using Flexdashboard caused a little trouble when using observeEvent(). But currently the apps works, but throws a warning regarding observeEvent() in respect to ...
[Read more...]

Trying R for the First Time

September 10, 2020 | Dario Radečić

All-time Pythonista tries out R — comparisons with Python included It’s not a secret that I’m a heavy Python user. Just take a look at my profile and you’ll find over 100 articles on Python itself, or Python in data science. Lately, I’ve been trying ou... [Read more...]

Video: How To Set Up A Distributed Data Science Team

September 10, 2020 | Appsilon

This presentation was part of a joint virtual webinar with Appsilon and RStudio on July 28, 2020 entitled “Enabling Remote Data Science Teams.” Find a direct link to the presentation here.  In this video, Appsilon Senior Data Scientist Olga Mierzwa-Sulima explains best practices for data science teams – whether your team is lucky ...
[Read more...]

Explaining models with Triplot, part 1

September 10, 2020 | Katarzyna Pękala

Explaining models with triplot, part 1tl;dr Explaining black box models built on correlated features may prove difficult and provide misleading results. R package triplot, part of the DrWhy.AI project, is aiming at facilitating the process of explainin...
[Read more...]

Simulating paths from a random walk

September 9, 2020 | kjytay

If you’ve ever visited this blog at wordpress.com, you might have noticed a header image that looks like this: Ever wonder how it was generated? The image depicts 100 simulations of an asymmetric random walk. In this post, I’ll go … Continue reading →
[Read more...]

Learning SQL and Exploring XBRL with secdatabase.com – Part 1

September 9, 2020 | R on Redwall Analytics

# Libraries
packages <- 
  c("data.table",
    "DBI",
    "reticulate",
    "keyring",
    "RAthena"
    )

if (length(setdiff(packages,rownames(installed.packages()))) > 0) {
  install.packages(setdiff(packages, rownames(installed.packages())))  
}

invisible(lapply(packages, library, character.only = TRUE))

knitr::opts_chunk$set(
  comment = NA,
  fig.width = 12,
  fig.height = 8,
  out.width = '100%'
)
Introduction 
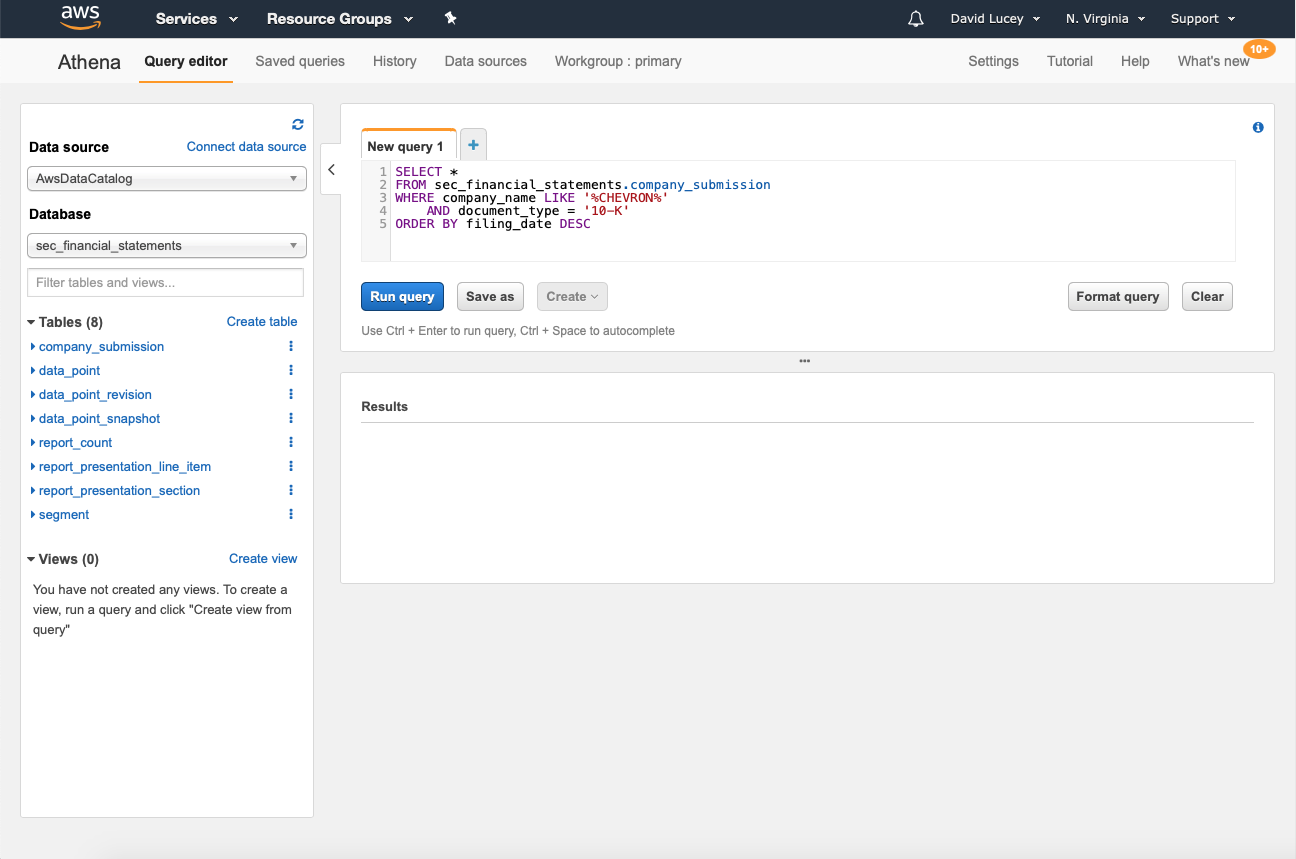
In A Walk Though of Accessing Financial Statements with XBRL in R - Part 1, we showed how to use R to extract Apple financial statement data from the SEC Edgar website. This would be a cumbersome process to scale across sectors, but works well for a single company. ...
[Read more...]

Expected goals from over/under odds

September 9, 2020 | opisthokonta

I got a comment the other day asking about whether it is possible to get the expected number of goals scored from over/under odds, similar to how you can do this for odds for win, draw or lose outcomes. The … Continue reading → [Read more...]

VirtuEARL workshops

September 9, 2020 | Laura Swales

At this years’ online version of the Enterprise Applications of R Language Conference, we have four workshops fo you to... The post VirtuEARL workshops appeared first on Mango Solutions. [Read more...]
1 7 8 9 10 11 13

Never miss an update!
Subscribe to R-bloggers to receive
e-mails with the latest R posts.
(You will not see this message again.)

Click here to close (This popup will not appear again)