March 2020

Learning bash

March 4, 2020 | Pete Talbert

Hello all! So I just bought a used MacBook Pro in order to learn Linux, bash, shell scripting, etc. This post is just to test that I can write bash code in an .Rmd file and it will show on my blog correctly. ls ## 2018-11-13-can-i-write-sql-in-r-mar... [Read more...]

COVID-19 epidemiology with R

March 4, 2020 | R Views

Tim Churches is a Senior Research Fellow at the UNSW Medicine South Western Sydney Clinical School at Liverpool Hospital, and a health data scientist at the Ingham Institute for Applied Medical Research, also located at Liverpool, Sydney. His background is in general medicine, general practice medicine, occupational health, public health ...
[Read more...]

Community Detection with Louvain and Infomap

March 4, 2020 | Niklas Junker

The number of different products and customers in any business area are practically infinite. But how can you find interactions between them like joint purchases and define groups? One solution is the so-called Community Detection. In this blog post, I want to show you the magic behind Community Detection and ...
[Read more...]

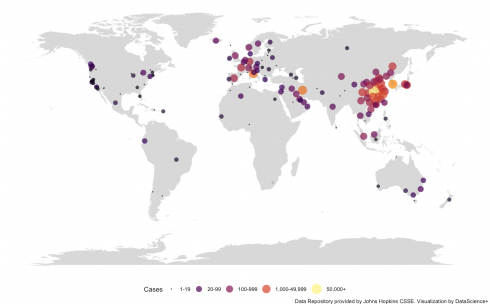
Map Visualization of COVID-19 Across the World with R

March 4, 2020 | Anisa Dhana

Are you interested in guest posting? Publish at DataScience+ via your RStudio editor. Category Visualizing Data Tags Data Visualisation ggplot2 R Programming Tips & Tricks As you may all know, a new virus named a coronavirus (COVID-19) is affecting a lot of people all over the world. The symptoms are ranging ...
[Read more...]

Nice tables in R

March 4, 2020 | fabiomarroni

I used to think that making nice table in R is not worth the effort. However, after changing my mind for the billionth time on relatively large tables for a paper and do not wanting to reformat them again from scratch, I gave a try to the formattable package, and ...
[Read more...]

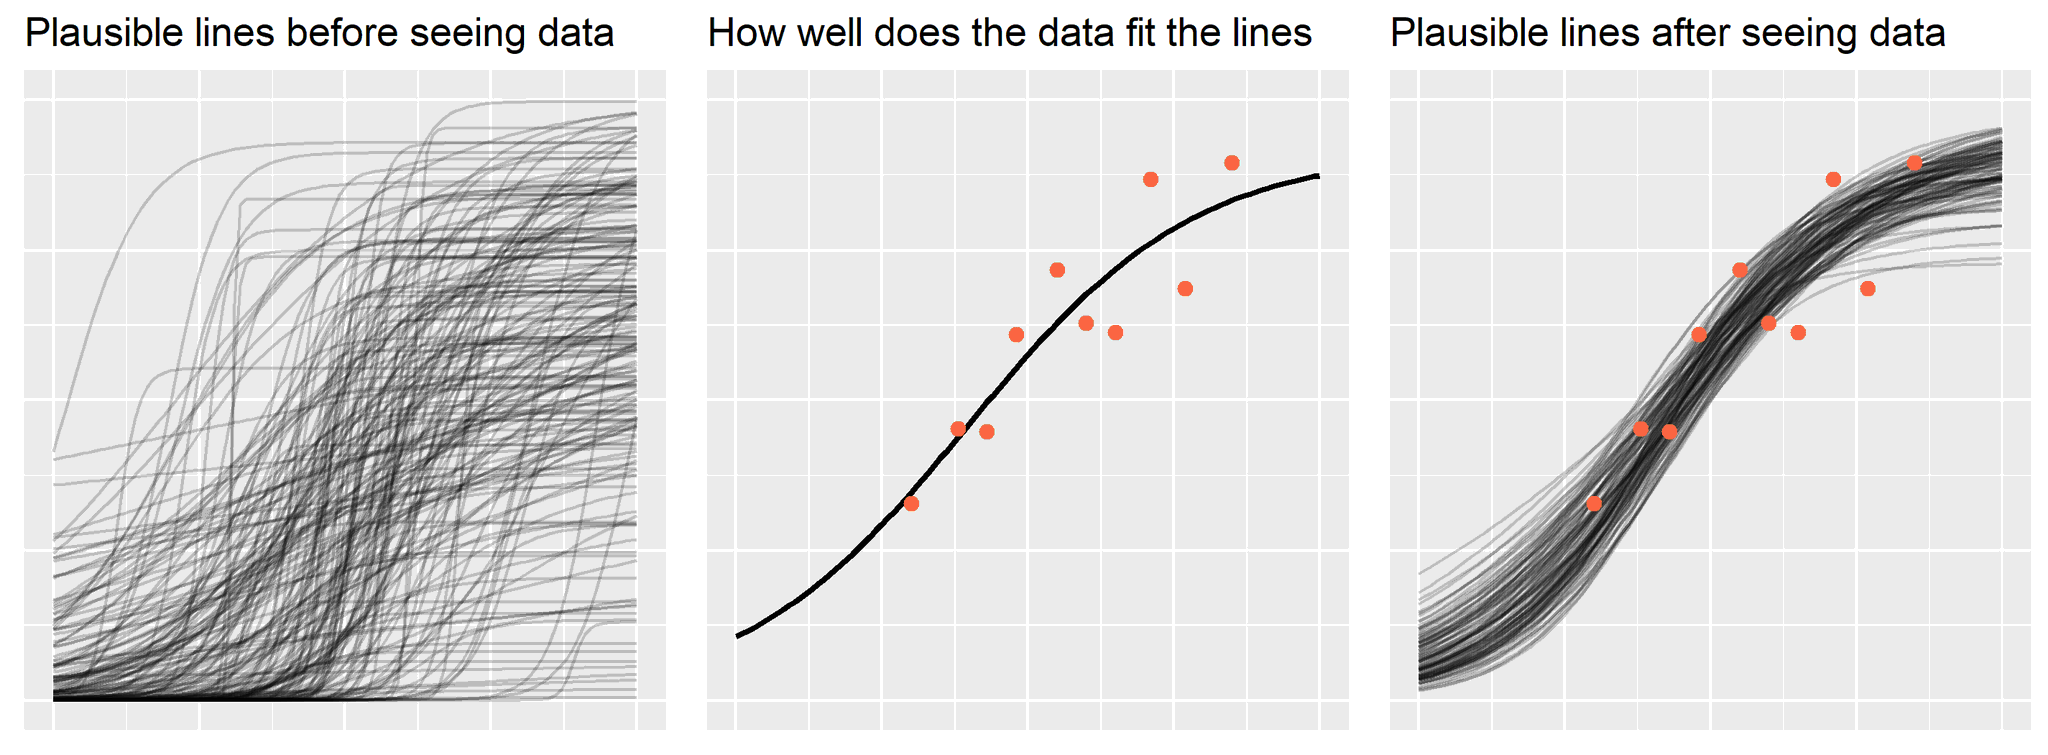
Bayes’ theorem in three panels

March 4, 2020 | Higher Order Functions

In my last post, I walked through an intuition-building visualization I created to describe mixed-effects models for a nonspecialist audience. For that presentation, I also created an analogous visualization to introduce Bayes’ Theorem, so here I will walk through that figure.. As in the earlier post, let’s start by ...
[Read more...]

All you need to know on Correspondence Analysis …

March 3, 2020 | francoishusson

Correspondence Analysis – CA – is an exploratory multivariate method for exploring and visualizing contingency tables, i.e. tables on which a chi-squared test can be performed. CA is particularly useful in text mining. The function Factoshiny of the package Factoshiny allows you to perform CA in an easy way. You can ...
[Read more...]

The Virtual Library, an R Shiny Application

March 3, 2020 | Michael Emmert

The Objective Organizing books by genre falls far short of telling a perspective reader if that book is of any interest to them.  Any one book can fall into dozens of categories while two books in the same category share almost nothing in common.  This makes identifying a good read ...
[Read more...]

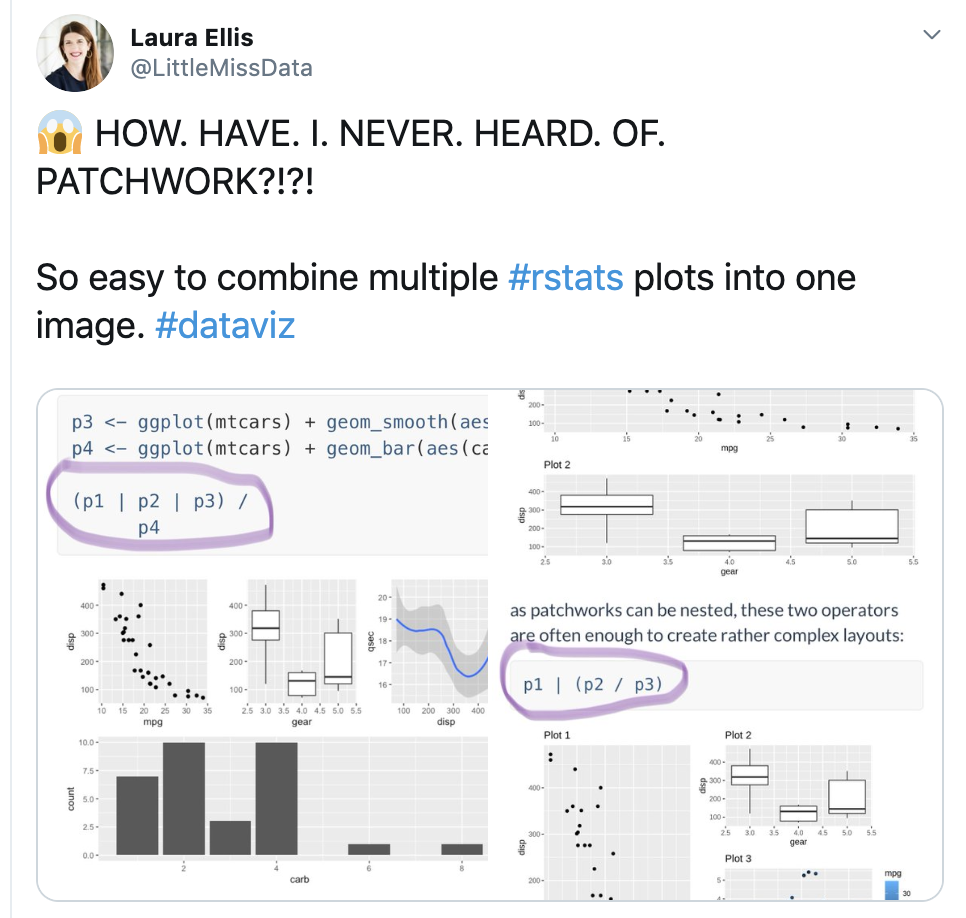
Patchwork R package goes nerd viral

March 3, 2020 | Laura Ellis

A few weeks ago, my tweet on the R patchwork package went nerd viral. I analyze the tweet performance and possible impact on the patchwork package downloads. I’ll arrange the resulting graphs with patchwork! As a bonus, I’ll show y’all how I added an image to the ...
[Read more...]
1 11 12 13 14

Never miss an update!
Subscribe to R-bloggers to receive
e-mails with the latest R posts.
(You will not see this message again.)

Click here to close (This popup will not appear again)