February 2019

You R my Valentine!

February 13, 2019 | Johannes B. Gruber on Johannes B. Gruber

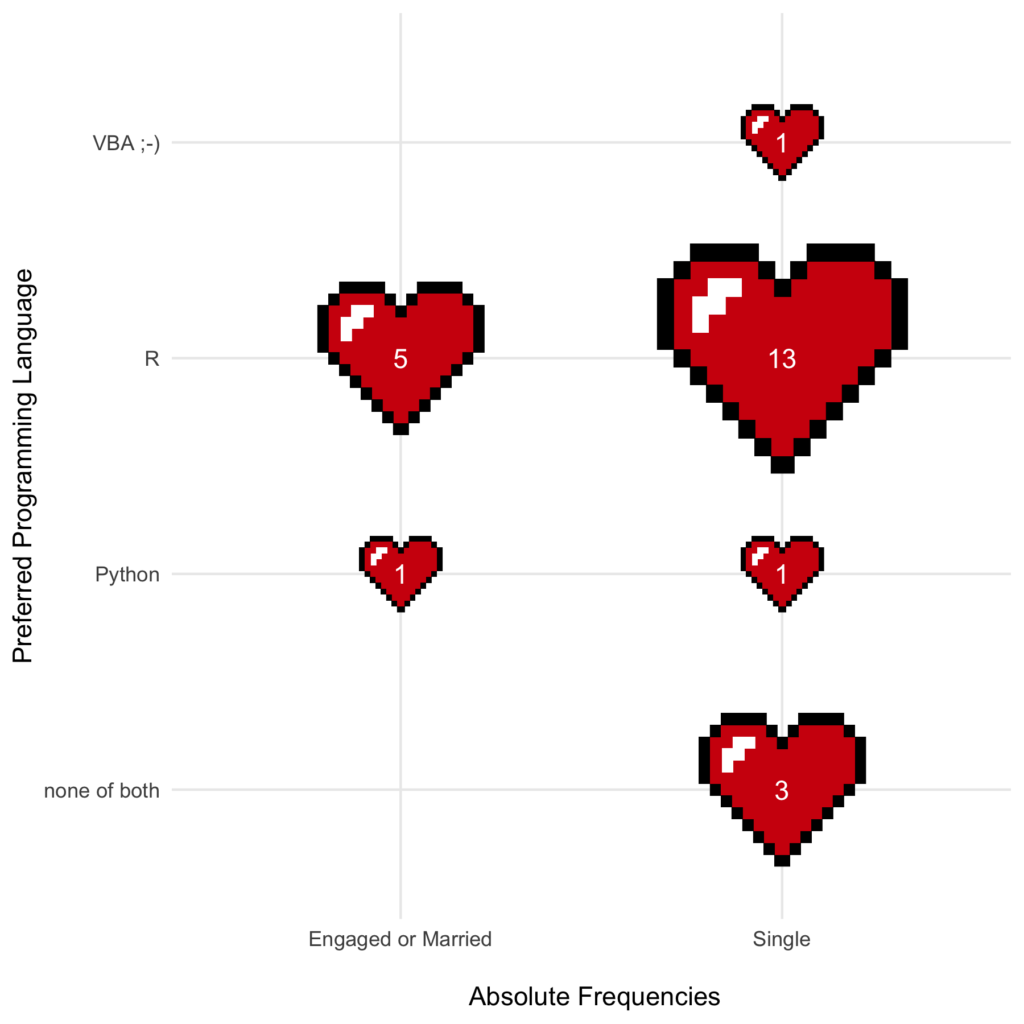
Today is Valentine’s Day. And since both I and my sweetheart are R enthusiasts, here is how to say “I love you” using a statistical programming language:
library("dplyr")
library("gganimate")
library("ggplot2")

hrt_dat <- data.frame(t = seq(0, 2 * pi, by = 0.01)) %>%
  bind_rows(data.frame(t = rep(max(.$t), 300))) %>% 
  mutate(xhrt = 16 * sin(t) ^ 3,
         yhrt = 13 * cos(t) - 5 * cos(2 * t) - 2 * cos(3 * t) - cos(4 * t),
         frame = seq_along(t)) %>% 
  mutate(text = ifelse(frame > 300, "            J", "")) %>%
  mutate(text = ifelse(frame > 500, "A           J", text)) %>%
  mutate(text = ifelse(frame > 628, "A     +     J", text)) %>% 
  mutate(texty = 0, textx = 0)

ggplot(hrt_dat, aes(x = xhrt, y = yhrt)) +
  geom_line(colour = "#C8152B") +
  geom_polygon(fill = "#C8152B") +
  geom_text(aes(x = textx, y = texty, label = text), 
            size = 18, 
            colour = "white",
            vjust = "center") +
  theme_void() +
  transition_reveal(frame)
[Read more...]

Are pollen forecast good enough?

February 13, 2019 | Assorted things

Introduction Maybe some of you (in my huge audience) have the bad luck of being allergic to pollen like myself. Since mid-January to the end of June I have to live very close to my antihistamines. Here in Madrid where I live health authorities issue newsletters (by email) with observations ...
[Read more...]

CIS Primer Question 3.3.3

February 13, 2019 | Brian Callander

CIS Primer Question 3.3.3 Posted on 14 February, 2019 by Brian Tags: CISP chapter 3, solutions, backdoor criteria Category: causal_inference_in_statistics_primer Here are my solutions to question 3.3.3 of Causal Inference in Statistics: a Primer (CISP). \(\DeclareMathOperator{\do}{do}\) The drug you have been assigned determines which ward you go to. Whether ... [Read more...]

CIS Primer Question 3.3.2

February 13, 2019 | Brian Callander

CIS Primer Question 3.3.2 Posted on 14 February, 2019 by Brian Tags: CISP chapter 3, solutions, lord's paradox, simpson's paradox Category: causal_inference_in_statistics_primer Here are my solutions to question 3.3.2 of Causal Inference in Statistics: a Primer (CISP). Part a The following DAG is a possible casual graph representing the situation. We ... [Read more...]

CIS Primer Question 3.3.1

February 13, 2019 | Brian Callander

CIS Primer Question 3.3.1 Posted on 14 February, 2019 by Brian Tags: CISP chapter 3, solutions, backdoor criteria Category: causal_inference_in_statistics_primer Here are my solutions to question 3.3.1 of Causal Inference in Statistics: a Primer (CISP). Part a and b For the causal effect of \(X\) on \(Y\), every backdoor path must ... [Read more...]

Working with big SAS datasets using R and sparklyr

February 13, 2019 | paoloeusebi

In general, R loads all data into memory while SAS allocates memory dynamically to keep data on disk. This makes SAS a better solution for handling very large datasets. I often need to work with large SAS data files that are prepared in the information system of my department. However, ...
[Read more...]

Generate multiple language version plots

February 13, 2019 | Michael

The use case is to create the same plot in different languages. I used this technique for Wikipedia plots. We are going to build a list containing all translations, we will then loop over each language, generating and saving the plot. Our plots as a nice gallery : [Read more...]

In memory of Monty Hall

February 12, 2019 | mrajter

Some find it a common knowledge, some find it weird. As a professor I usually teach about Monty Hall problem and year after year I see puzzling looks from students regarding the solution. Image taken from http://media.graytvinc.com/images/690*388/mon+tyhall.jpg The original and most simple scenario ...
[Read more...]

So, what is AI really?

February 12, 2019 | Learning Machines

One of the topics that is totally hyped at the moment is obviously Artificial Intelligence or AI for short. There are many self-proclaimed experts running around trying to sell you the stuff they have been doing all along under this new label. When you ask them what AI means you ... [Read more...]

RFM Analysis in R

February 11, 2019 | Rsquared Academy Blog - Explore Discover Learn

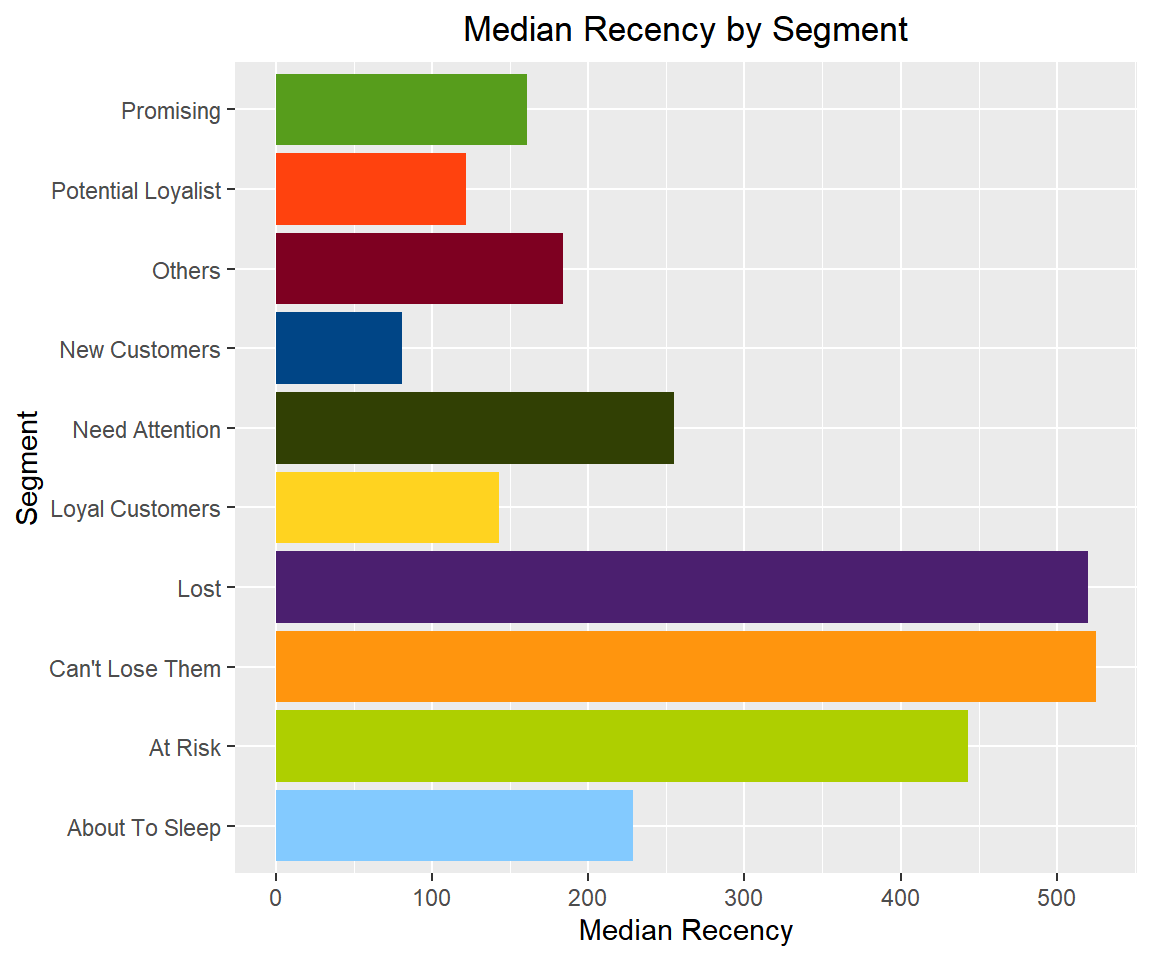
We are pleased to announce the rfm package, a set of tools for recency, frequency and monetary value analysis, designed keeping in mind beginner/intermediate R users. It can handle: transaction level data customer level data Installation
# Install release version from CRAN
install.packages("rfm")

# Install development version from GitHub
# install.packages("devtools")
devtools::install_github("rsquaredacademy/rfm")
Shiny App rfm includes a shiny app which can be launched using {{...
[Read more...]

Meetup 02-2019 Minutes

February 11, 2019 | Vienna-R

Self Service Data Preparation und Data Science Peter Jeitschko Peter presented Alteryx, a platform built for Business Analysts to master tasks like data management, data cleaning and modelling. The tool is windows only and will be ported to Linux... [Read more...]

R Vocabulary – Part 3

February 11, 2019 | Anindya Mozumdar

This is the third part of the series of articles on R vocabulary. In this series, we explore most of the functions mentioned in Chapter 2 of the book Advanced R. The first part of the series can be read here and the second part of the series can be read ... [Read more...]

Meetup 02-2019 Minutes

February 11, 2019 | Vienna-R

Self Service Data Preparation und Data Science Peter Jeitschko Peter presented Alteryx, a platform built for Business Analysts to master tasks like data management, data cleaning and modelling. The tool is windows only and will be ported to Linux soon. It can connect to multiple data sources and helps Business ... [Read more...]

PlayerIds

February 11, 2019 | Analysis of AFL

Something that has been talked a bit about recently on twitter is the the use of unique playerIDs so that fan analysts, punters and bloggers can track players through time. There are some things that need to be thought about when creating unique playerIDS for analysis. Do you want your ... [Read more...]
1 6 7 8 9 10 13

Never miss an update!
Subscribe to R-bloggers to receive
e-mails with the latest R posts.
(You will not see this message again.)

Click here to close (This popup will not appear again)