2018
Week 12 Gold Mining and Fantasy Football Projection Roundup now available. Go get that free agent gold!
The post Gold-Mining Week 12 (2018) appeared first on Fantasy Football Analytics.
[Read more...]
Beautiful Chaos: The Double Pendulum
This post is dedicated to the beautiful chaos created by double pendulums. I have seen
a great variety of animated versions, implemented with different tool but never in R.
Thanks to the amazing package gganimate, it is actually not that hard to produce them in R.
library(tidyverse)
library(gganimate)
I am not ... [Read more...]
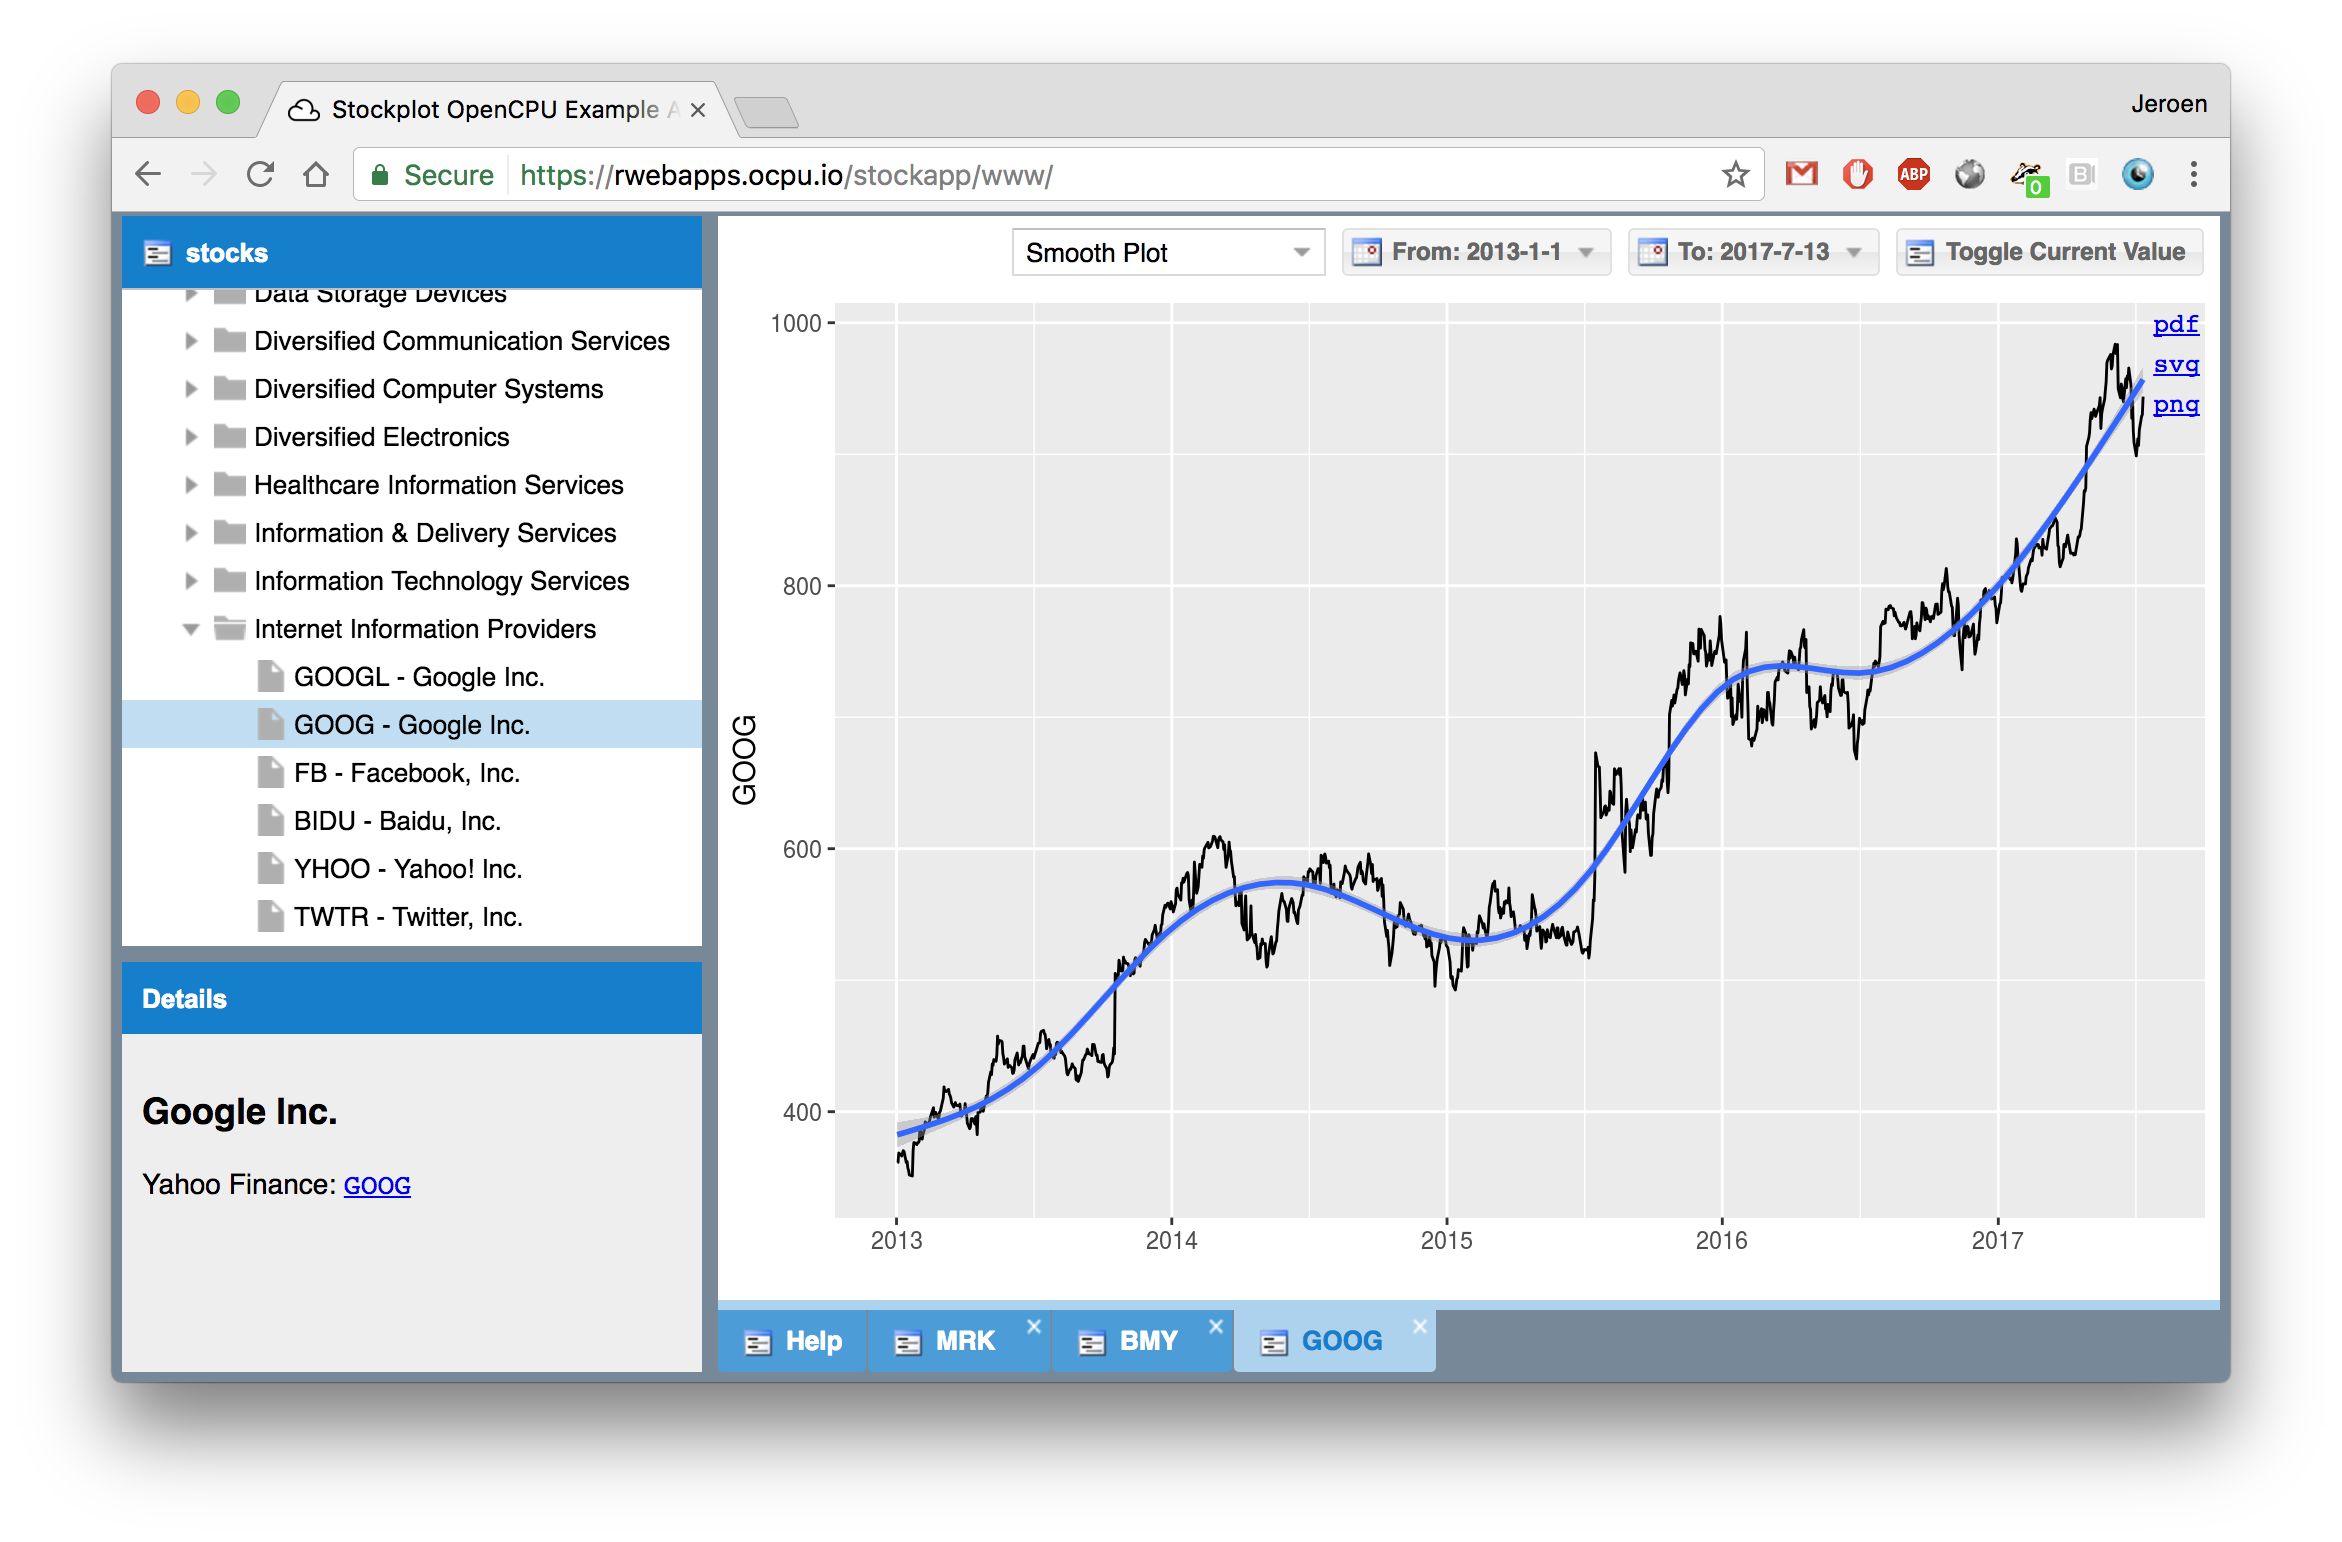
OpenCPU 2.1 Release: Scalable R Services
OpenCPU provides a mature and robust system for hosting R based services. The server exposes a simple HTTP API for calling R functions, scripts and managing data. The Cloud Server is completely free and scales up to many concurrent users. T...

Le Monde puzzle [#1075]
A Le Monde mathematical puzzle from after the competition: A sequence of five integers can only be modified by subtracting an integer N from two neighbours of an entry and adding 2N to the entry. Given the configuration below, what is the minimal number of steps to reach non-negative entries ...

Machine Learning. In conversation with Jelena Ilic, Senior Data Scientist at Mango Solutions
Ruth Thomson, Interim Director of Strategic Innovation sat down with Jelena, one of Mango’s machine learning experts. Thanks Jelena for your time. It is an absolute pleasure to have this opportunity to discuss machine learning today. Tell me about your background with machine learning I’ve been using machine ... [Read more...]
Improvements to fuzzySim functions
A few improvements were recently made to several functions in the fuzzySim package. Mainly, function modelTrim is now more independent (it used to require “attach” sometimes); multTSA allows either “AIC” or “significance” as a backward stepwise selection criterion, and provides … Continue reading →
[Read more...]
Cluster Analysis – Part 2: Hands On
library(broom) library(cluster) library(dplyr) library(ggplot2) library(ggdendro) In the first part of this blog series, we examined the theoretical foundations of cluster analysis. In the following article we put the theory into practice using R. For the analysis in R, we will use the variables mpg (fuel ...

RTutor: Driving Electric or Gasoline Cars? Comparing the Pollution Damages
How does driving an electric car compare to driving a similar gasoline car in terms of total pollution damages? While some comments about the future of mobility may suggest that electric cars are already clearly much more environmental friendly, the an... [Read more...]
Scrapping data about Australian politicians with RSelenium
While there is more and more data available in structured formats (CSV, JSON) through initiatives like OpenData, sometimes nicely formatted data still not publicly available. When I decided to conduct a little study of what Australian politicians from the major party post in Twitter. So I decide to find list…
...

R > Python: a Concrete Example
I like both Python and R, and teach them both, but for data science R is the clear choice. When asked why, I always note (a) written by statisticians for statisticians, (b) built-in matrix type and matrix manipulations, (c) great graphics, both base and CRAN, (d) excellent parallelization facilities, etc. ...

Setting up your own Shiny and RStudio Server on a Raspberry Pi 3B+
Preparing The Raspberry Pi
Setting Up The Server
Installing Shiny Server
Installing Rstudio Server
Extra Steps
Final Comments
I have recently participated in a topic at RStudio Community where @jladata was asking if a Raspberry Pi 3B+ could make it as a viable Shiny server, I currently use a Raspberry ... [Read more...]
The Case Against Precision as a Model Selection Criterion
Recently, I have introduced sensitivity and specificity as performance measures for model selection. Besides these measures, there is also the notion of recall and precision. Precision and recall originate from information retrieval but are also used in machine learning settings. However, the use of precision and recall can be problematic ...

An Overview of the Singapore Hiring Landscape
The idea of having a 360 degree view of the entire job seeking and matching landscape has always been a dream of any labour economist. Just imagine, a dataset of CVs and job seekers matched with job advertisements and openings! The potential of such a dataset to answer existing questions on ...

The best way to visit Luxembourguish castles is doing data science + combinatorial optimization
Inspired by David Schoch’s blog post,
Traveling Beerdrinker Problem.
Check out his blog, he has some amazing posts!
Introduction
Luxembourg, as any proper European country, is full of castles. According to Wikipedia,
“By some optimistic estimates, there are as many as 130 castles in Luxembourg but more realistically
there are ... [Read more...]
Checklist Recipe – How we created a template to standardize species data
Imagine you are a fish ecologist who compiled a list of fish species for your country. ????
Your list could be useful to others, so you publish it as a supplementary file to an article or in a research repository. That is fantastic, but it might be difficult for others to ... [Read more...]
R Script prep for GOplot from Trinity
This post contains an adapted R script based on prep_n_run_GOplot.pl from Trinity, the denovo transcriptome assembler, for the times R cannot read in the produced EC.* files.
prep_n_run_GOplot.pl is used to produce GOplot visualizing differential expression, sorted by GO terms (see http://... [Read more...]
Slides from my talks about Demystifying Big Data and Deep Learning (and how to get started)
On November 7th, Uwe Friedrichsen and I gave our talk from the JAX conference 2018: Deep Learning - a Primer again at the W-JAX in Munich.
A few weeks before, I gave a similar talk at two events about Demystifying Big Data and Deep Learning (and how to... [Read more...]
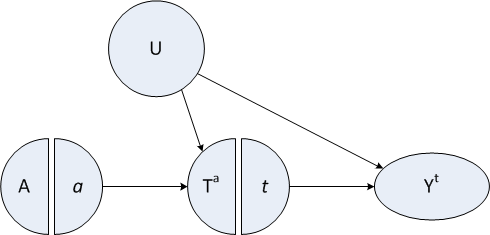
Generating data to explore the myriad causal effects that can be estimated in observational data analysis
I’ve been inspired by two recent talks describing the challenges of using instrumental variable (IV) methods. IV methods are used to estimate the causal effects of an exposure or intervention when there is unmeasured confounding. This estimated causal effect is very specific: the complier average causal effect (CACE). But, ...

What R package for phylogenetics is the most popular?
While writing my first R package and its associated manuscript, I needed to talk about some other R packages in the phylogenetics research community. The most obvious choice would be to just cite the ones that I actually use, but that doesn’t n... [Read more...]
Zero Counts in dplyr
Here’s a feature of dplyr that occasionally bites me (most recently while making these graphs). It’s about to change mostly for the better, but is also likely to bite me again in the future. If you want to follow along there’s a GitHub repo with the necessary ... [Read more...]
Copyright © 2022 | MH Corporate basic by MH Themes