February 2018

What does Microsoft do with R?

February 13, 2018 | David Smith

I was genuinely chuffed to get a shout-out in the most recent episode of Not So Standard Deviations, the awesome statistics-and-R themed podcast hosted by Hilary Parker and Roger Peng. In that episode, Roger recounts his recent discovery of the Microsoft ecosystem of tools for R, which he (jokingly) dubbed ... [Read more...]

pandas vs. data.table – A study of data-frames

February 13, 2018 | Christian Moreau

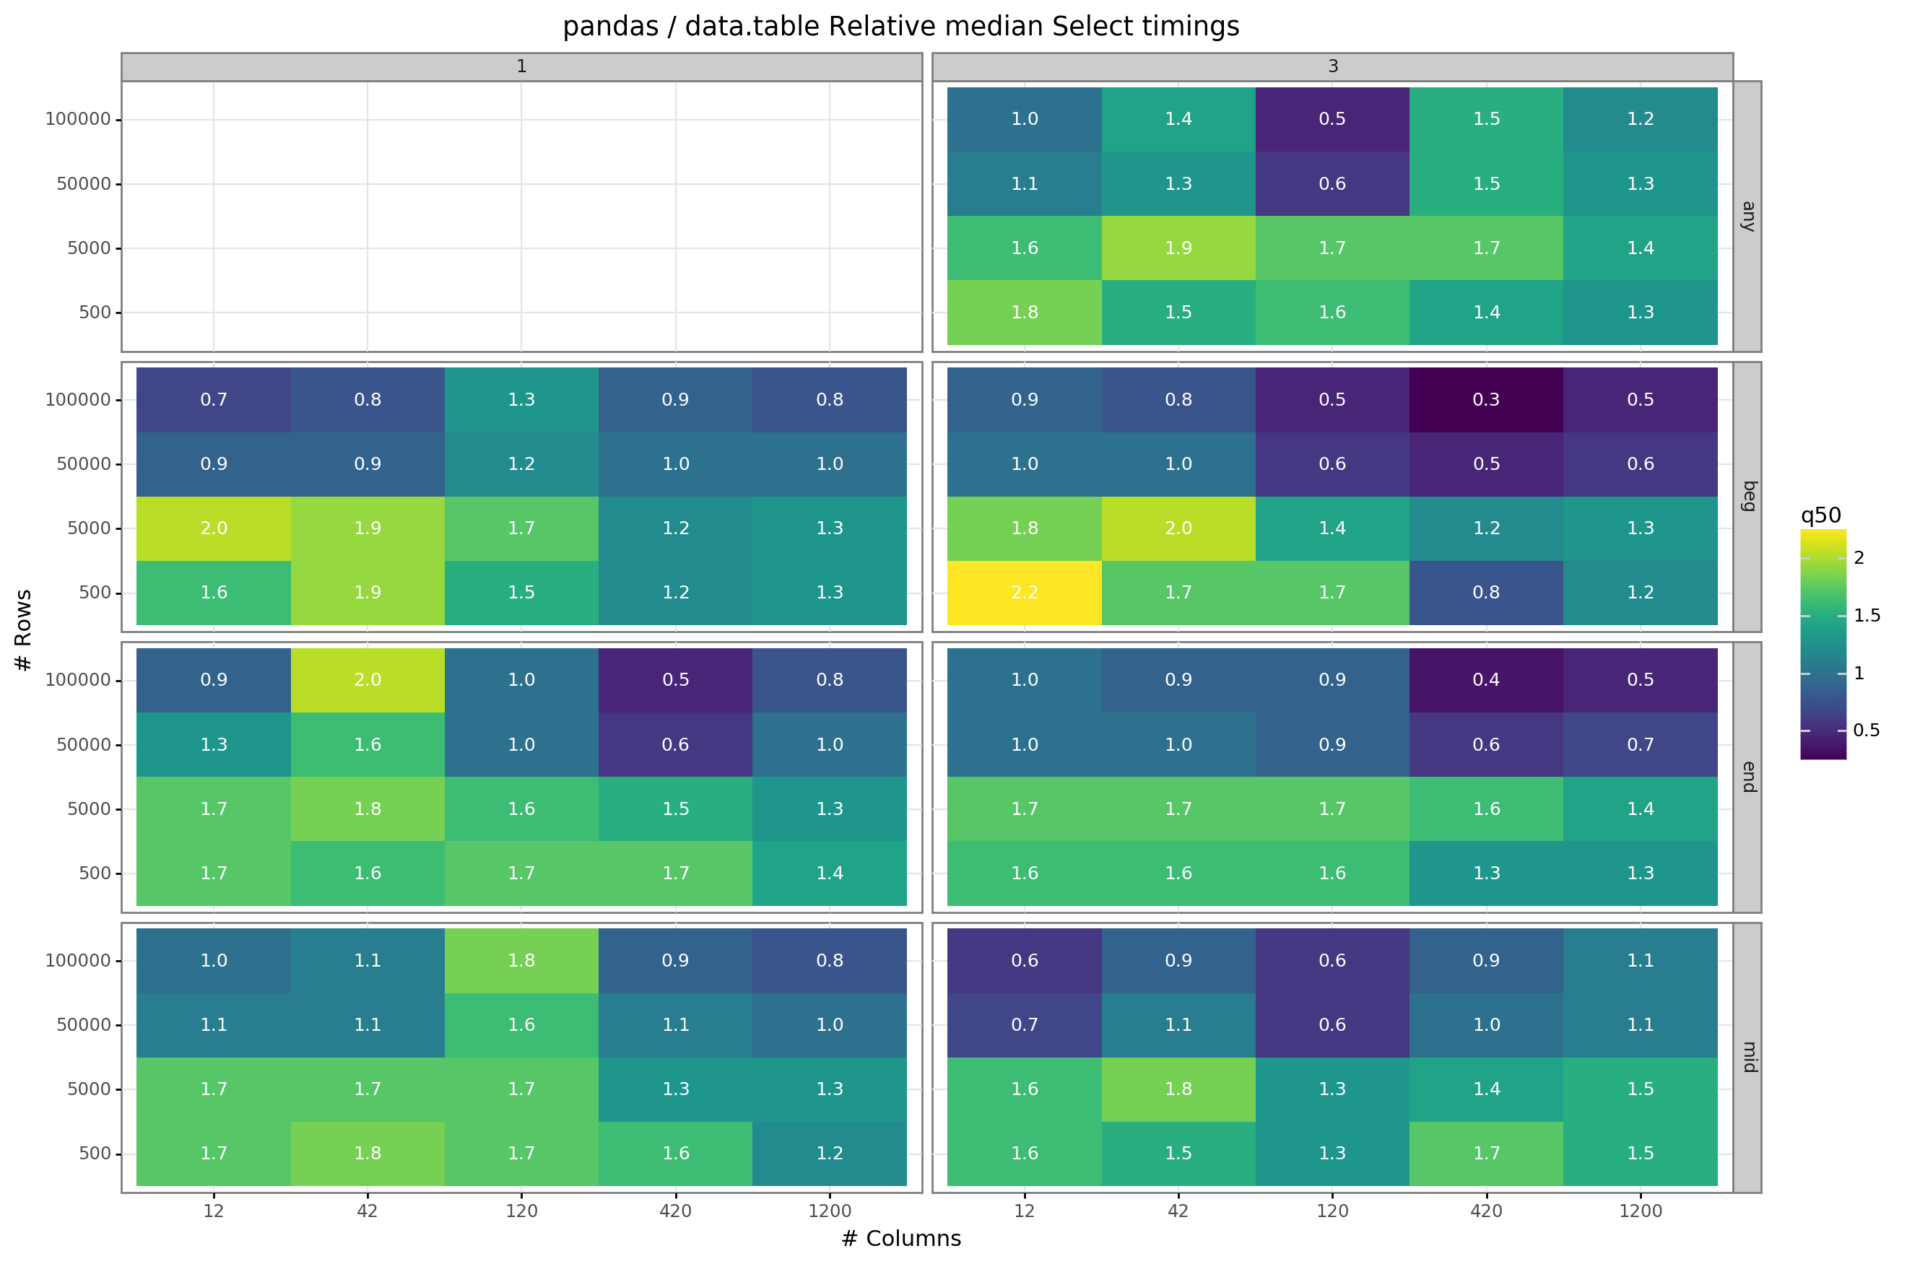
Overview and Setting Python and R have become the most important languages in analytics and data science. Usually a data scientist can at least navigate one language with relative ease and at STATWORX we luckily have both expertises available. While, with enough will and effort, any coding project can be ...
[Read more...]

Is 10,000 Cells Big?

February 12, 2018 | John Mount

Trick question: is a 10,000 cell numeric data.frame big or small? In the era of "big data" 10,000 cells is minuscule. Such data could be fit on fewer than 1,000 punched cards (or less than half a box). The joking answer is: it is small when they are selling you the system, ...
[Read more...]

Diversity scholarships for upcoming R conferences

February 12, 2018 | David Smith

One of the greatest things about the R community is its diversity. This is largely thanks to organizations like Forwards and R-Ladies, who have been instrumental in welcoming women and other under-represented groups to the world of R. Likewise, conferences in the R community encourage diversity, with open codes of ... [Read more...]

How to Access Datasets in R

February 12, 2018 | Datazar

Have you spent hours, pulling your hair out trying to figure out how to access datasets in R? Once imported to a variable, columns from a dataset (eg: CSV) can be very tricky to access. Sometimes columns contain spaces, funky characters or other incosistencies. Here are some examples on how ...
[Read more...]

Parametric Portfolio Policies

February 11, 2018 | insightr

By Gabriel Vasconcelos Overview There are several ways to do portfolio optimization out there, each with its advantages and disadvantages. We already discussed some techniques here. Today I am going to show another method to perform portfolio optimization that works … Continue reading →
[Read more...]

ggplot2: Legend – Part 1

February 11, 2018 | Rsquared Academy Blog

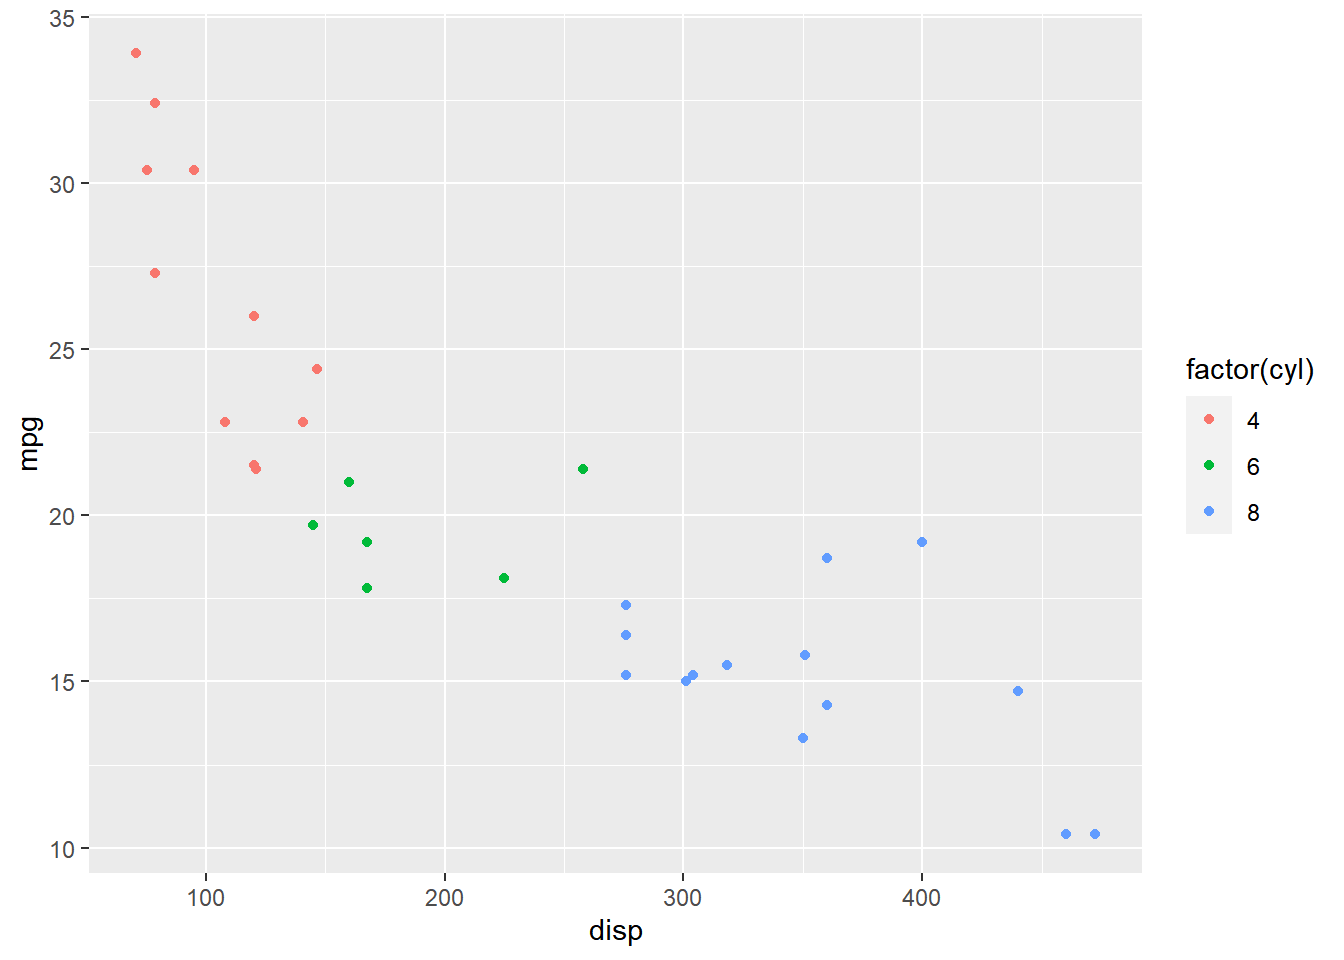
Introduction This is the 13th post in the series Elegant Data Visualization with ggplot2. In the previos post, we learnt how to modify the axis of plots. In this post, we will focus on modifying the appearance of legend of plots when the aesthetics are mapped to variables. Specifically, we ...
[Read more...]

tidygraph 1.1 – A tidy hope

February 11, 2018 | Data Imaginist

I am very pleased to tell you that the next version of tidygraph (1.1) is now available on CRAN. This is not a bug-fix release, nor a change-it-all release, but rather a more-of-it-all release, and in this post I’m going to tell you all about it. The idea of tidygraph ...
[Read more...]

Robotstxt Update – v0.6.0 on CRAN

February 11, 2018 | petermeissner

I just got the news from the CRAN-team that the robotstxt version update 0.6.0 was accepted and now is available. The robotstxt package aims at working with robots.txt files from within R by providing a parser as well as a permission checker - and s... [Read more...]

R Interfaces to Python Keras Package

February 11, 2018 | statcompute

Keras is a popular Python package to do the prototyping for deep neural networks with multiple backends, including TensorFlow, CNTK, and Theano. Currently, there are two R interfaces that allow us to use Keras from R through the reticulate package. While the keras R package is able to provide a ... [Read more...]

Retrieve data.world data sets in Power BI using R

February 10, 2018 | aaronddl

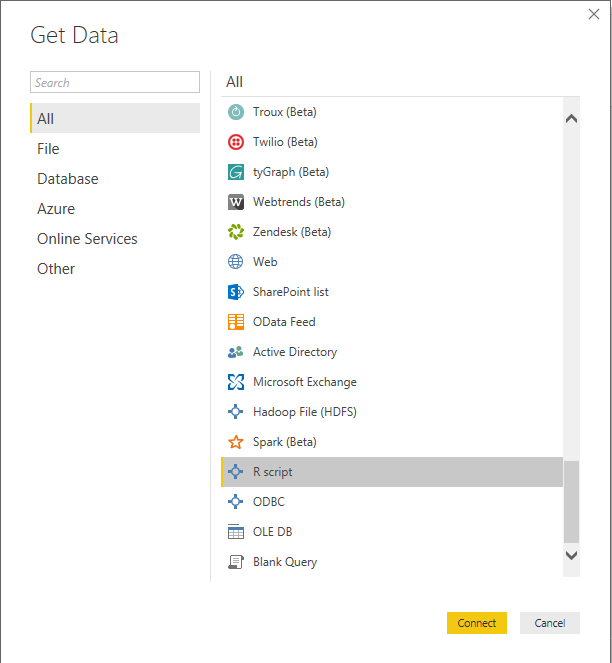
[update: the data.world connector is now available in beta, as a preview feature in Power BI. However, this post is relevant in case you’d like to manage what you retrieve through your own code] data.world is a website promising “open, secure, social, and linked” data sets. Using ...
[Read more...]

Probabilistic Sensitivity Analysis with R

February 9, 2018 | Devin Incerti

Overview Normal distribution Multivariate normal distribution Beta distribution Dirichlet distribution Gamma and lognormal distributions Uniform distribution Performing a PSA Overview Decisions to adopt or reimburse health technologies are often guided by cost-effectiveness analyses. The outcomes needed to conduct cost-effectiveness analyses are simulated using decision-analytic models, which combine information from multiple ...
[Read more...]
1 6 7 8 9 10 12

Never miss an update!
Subscribe to R-bloggers to receive
e-mails with the latest R posts.
(You will not see this message again.)

Click here to close (This popup will not appear again)