June 2018

(Unit) Testing Shiny apps using testthat

June 26, 2018 | Ferand Dalatieh

This blog post explains how to test a Shiny app using shinytest and testthat packages. Basic knowledge about Shiny apps and the principle of unit testing using testthat is useful, but not required here. Example of a Shiny app The packages shiny (current version: 1.1.0), testthat (2.0.0) and shinytest (1.3.0) are required for ... [Read more...]

Storrrify #satRdayCDF 2018

June 25, 2018 | Posts on Maëlle's R blog

On Saturday I was at my second satRday conference this year, lucky me! I got to attend satRday Cardiff which was a great experience. I gave a talk about rOpenSci onboarding system of packages, find my slidedeck here and other slidedecks at this address. A lot of R goodness! As ... [Read more...]

A package for tidying nested lists

June 25, 2018 | rOpenSci - open tools for open science

Data == knowledge! Much of the data we use, whether it be from government repositories, social media, GitHub, or e-commerce sites comes from public-facing APIs. The quantity of data available is truly staggering, but munging JSON output into a format that is easily analyzable in R is an equally staggering undertaking. ...
[Read more...]

May 2018: “Top 40” New Packages

June 25, 2018 | R Views

While looking over the 215 or so new packages that made it to CRAN in May, I was delighted to find several packages devoted to subjects a little bit out of the ordinary; for instance, bioacoustics analyzes audio recordings, freegroup looks at some abstract mathematics, RQEntangle computes quantum entanglement, stemmatology analyzes ...
[Read more...]

Rollercoaster III: yet more on Google Scholar

June 25, 2018 | quantixed

In a previous post I made a little R script to crunch Google Scholar data for a given scientist. The graphics were done in base R and looked a bit ropey. I thought I’d give the code a spring clean – it’s available here. The script is called ggScholar....
[Read more...]

Demography simulations by @ellis2013nz

June 25, 2018 | free range statistics - R

Total fertility rate This is my second blog post while familiarising myself with the arithmetic of demography. In my earlier post I looked at how life expectancy is calculated. “Period life expectancy at birth” as estimated by national statistical offices is actually best thought of as a summary of death ... [Read more...]

A Different Free Kick Ladder

June 24, 2018 | Analysis of AFL

Each week triplemfooty tweets out a free kick ladder that is based only on total free kick differential throughout the season. But what if we did a ladder in the same style of the home and away ladder. 4 points for a win (winning free kick count in game) 2 points for ...
[Read more...]

Dealing with missing data in ANOVA models

June 24, 2018 | Simon Grund [R]

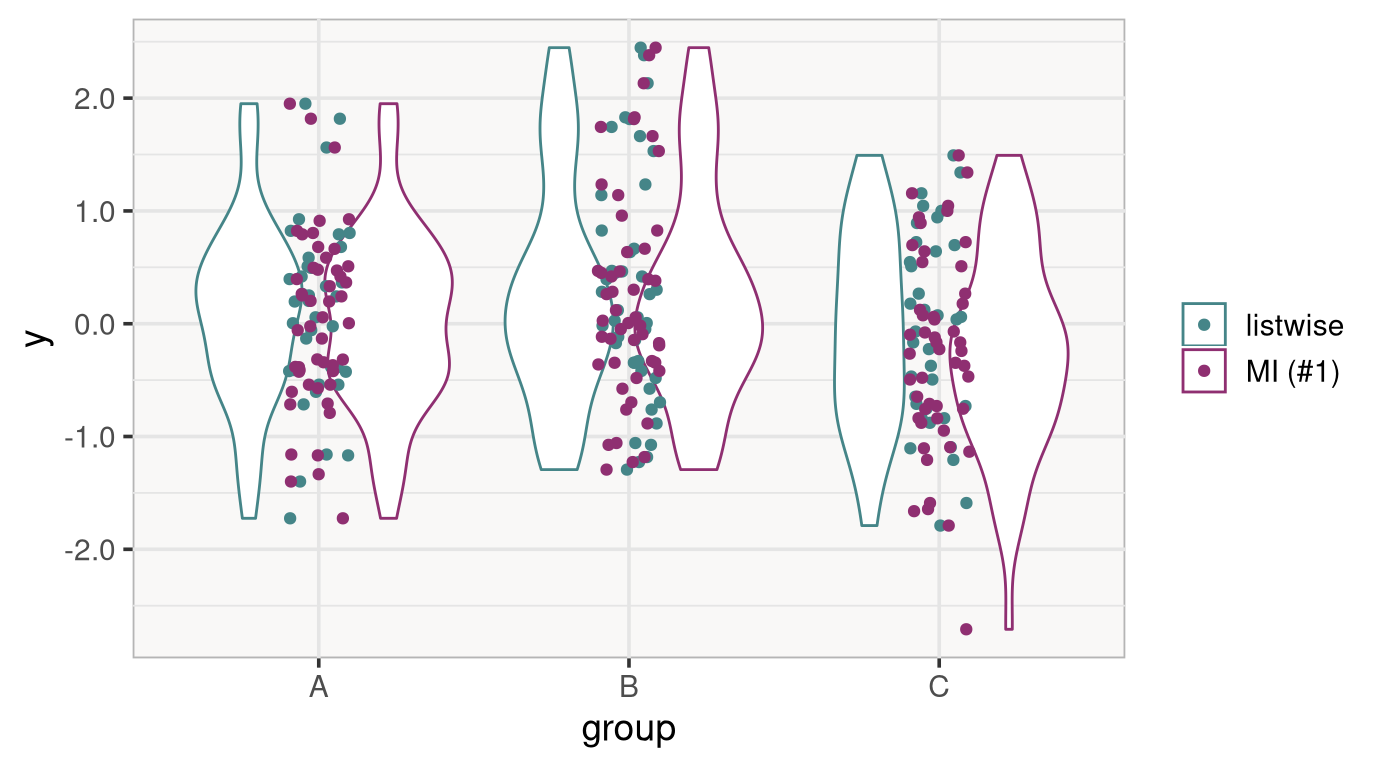
The analysis of variance, or ANOVA, is among the most popular methods for analyzing how an outcome variable differs between groups, for example, in observational studies or in experiments with different conditions. But how do we conduct the ANOVA when there are missing data? In this post, I show how ...
[Read more...]

Why R 2018 Winners

June 24, 2018 | R on The Jumping Rivers Blog

How we did it The winners So it’s here… After lots of entries (147 to be precise), we can finally announce the winner of the WhyR 2018 Competition! But first, we have to tell you quickly about how we picked the winner. How we did it So it really wasn’t ...
[Read more...]
1 2 3 4 5 15

Never miss an update!
Subscribe to R-bloggers to receive
e-mails with the latest R posts.
(You will not see this message again.)

Click here to close (This popup will not appear again)