
June 2018

New R package xplain: Providing interactive interpretations and explanations of statistical results
The package xplain is designed to help users interpret the results of their statistical analyses. It does so not in an abstract way as textbooks do. Textbooks do not help the user of a statistical method understand his findings directly. What does... [Read more...]
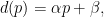
Different demand functions and optimal price estimation in R
By Yuri Fonseca Demand models In the previous post about pricing optimization (link here), we discussed a little about linear demand and how to estimate optimal prices in that case. In this post we are going to compare three different … Continue reading →
rqdatatable: rquery Powered by data.table
rquery is an R package for specifying data transforms using piped Codd-style operators. It has already shown great performance on PostgreSQL and Apache Spark. rqdatatable is a new package that supplies a screaming fast implementation of the rquery system in-memory using the data.table package. rquery is already one of ...

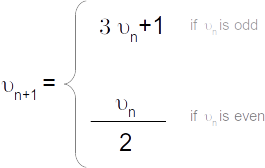
Collatz Sequence – part 2
On first post part , we got some intuition about Collatz sequence], that seems to be unproven yet. Let’s try to prove it mathematically.
Some mathematic reminders
Canonical form a a natural integer
We name canonical form any natural integer n, written under one of following forms
n = 10 t + u
...
Fancy Plot (with Posterior Samples) for Bayesian Regressions
The Model
Plot
Credits
As Bayesian models usually generate a lot of samples (iterations), one could want to plot them as well, instead (or along) the posterior “summary” (with indices like the 90% HDI). This can be done quite easily by extracting all the iterations in get_predicted from the psycho ...

Even Simpler SQL
I’ve had some feedback on the last post, and rather than repeat the same thing multiple times, I’m going all @drob, and writing this instead..
When I tweeted out the link to my post I gave it the tag line “why I’d rather write dplyr than SQL”.
... [Read more...]
Classification from scratch, penalized Ridge logistic 4/8
Fourth post of our series on classification from scratch, following the previous post which was some sort of detour on kernels. But today, we’ll get back on the logistic model. Formal approach of the problem We’ve seen before that the classical estimation technique used to estimate the parameters ...

How To Plot With Patchwork: Exercises
INTRODUCTION The goal of patchwork is to make it simple to combine separate ggplots into the same graphic. It tries to solve the same problem as gridExtra::grid.arrange() and cowplot::plot_grid, but using an API that incites exploration and iteration. Before proceeding, please follow our short tutorial. Look ... [Read more...]
valueBox without ShinyDashboard
Aim of the Fuction: [Read more...]
valueBox without ShinyDashboard
Aim of the Fuction: Reproduce the valueBox function From ShinyDashboard package with almost the same functionality. This function becomes usable without loading ShinyDashboard package and without using the required dashboard […] [Read more...]
Ceteris Paribus Plots – a new DALEX companion
If you like magical incantations in Data Science, please welcome the Ceteris Paribus Plots. Otherwise feel free to call them What-If Plots. Ceteris Paribus (latin for all else unchanged) Plots explain complex Machine Learning models around a single observation. They supplement tools like breakDown, Shapley values, LIME or LIVE. In ... [Read more...]
StatCheck the Game
If you don't get enough joy from publishing scientific papers in your day job, or simply want to experience what it's like to be in a publish-or-perish environment where the P-value is the only important part of a paper, you might want to try StatCheck: the board game where the ... [Read more...]
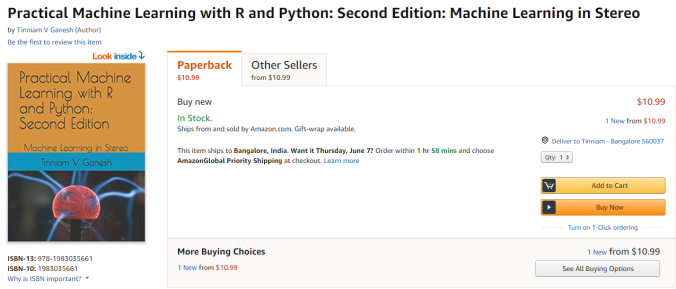
My book ‘Practical Machine Learning in R and Python: Second edition’ on Amazon
The second edition of my book ‘Practical Machine Learning with R and Python – Machine Learning in stereo’ is now available in both paperback ($10.99) and kindle ($7.99/Rs449) versions. This second edition includes more content, extensive comments and formatting for better readability. In this book I implement some of the most common, ...
Praise you like I should: Shiny Appreciation Month
Aimée Gott, Education Practice Lead
Back in the summer of 2012 I was meant to be focusing on one thing: finishing my thesis. But, unfortunately for me, a friend and former colleague came back from a conference (JSM) and told me all about a new package that she had seen ...

Coloring Sudokus
Someday you will find me caught beneath the landslide (Champagne Supernova, Oasis) I recently read a book called Snowflake Seashell Star: Colouring Adventures in Numberland by Alex Bellos and Edmund Harris which is full of mathematical patterns to be coloured. All images are truly appealing and cause attraction to anyone ...

Copyright © 2022 | MH Corporate basic by MH Themes