June 2017

NAFTA trade dashboard

June 18, 2017 | En El Margen - R-English

Tradewatch is a dashboard, written in R using the flexdashboard framework. Visualizations are made possible thanks to highcharter and other packages. The main purpose of the dashboard is to monitor trade, mostly from the Mexican perspective, of goods... [Read more...]
R⁶ — Disproving Approval

June 18, 2017 | hrbrmstr

I couldn’t let this stand unchallenged: The new Rasmussen Poll, one of the most accurate in the 2016 Election, just out with a Trump 50% Approval Rating.That's higher than O's #'s!— Donald J. Trump (@realDonaldTrump) June 18, 2017 Ramussen makes their Presidential polling data available for both ? & O. Why not compare their ...
[Read more...]

Pretty errors, warnings and messages in R Markdown

June 18, 2017 | David Selby

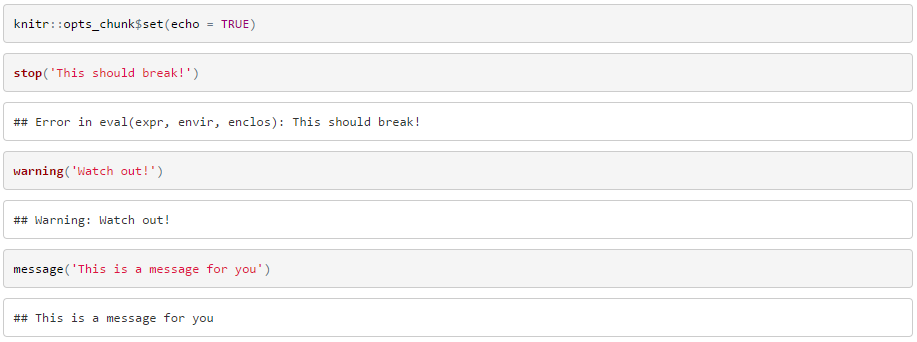
When knitting an R Markdown document to HTML output, R chunks can produce warnings, errors or messages. Normally these messages look like any other console output: Pretty ugly, and usually something I find myself trying to hide at the earliest opportunity. But if you’re using R Markdown’s default ...
[Read more...]

Benchmarking the Performance of R Code

June 17, 2017 | Luke Singham

To assess the performance of R code there's a great little package called microbenchmark. install.packages('microbenchmark') library(microbenchmark) I was particularly interested in the performance increase of a shiny application that reads in ... [Read more...]

tidytext 0.1.3

June 17, 2017 | Rstats on Julia Silge

I am pleased to announce that tidytext 0.1.3 is now on CRAN! In this release, my collaborator David Robinson and I have fixed a handful of bugs, added tidiers for LDA models from the mallet package, and updated functions for changes to quanteda’s API. You can check out the NEWS ...
[Read more...]

Partial least squares in R

June 17, 2017 | Francisco Lima

My last entry introduces principal component analysis (PCA), one of many unsupervised learning tools. I concluded the post with a demonstration of principal component regression (PCR), which essentially is a ordinary least squares (OLS) fit using the first principal components (PCs) from the predictors. This brings about many advantages: There ...
[Read more...]

Superstorm Sandy at the Delaware Estuary Revisited

June 17, 2017 | AdventuresInData

Continuing on the theme of updating older visualizations into newer formats, below is a clip of the impact of Superstorm Sandy on Delaware Estuary water surface elevations.  The original MS Excel and screen capture version is posted here.  The new version developed in R with the animation package is cleaner ... [Read more...]

Using the xlsx package to create an Excel file

June 17, 2017 | sindri

Microsoft Excel is perhaps the most popular data anlysis tool out there. While arguably convenient, spreadsheet software is error prone and Excel code can be very hard to review and test. After successfully completing this exercise set, you will be able to prepare a basic Excel document using just R (... [Read more...]

Weather forecast with regression models – part 4

June 16, 2017 | Giorgio Garziano

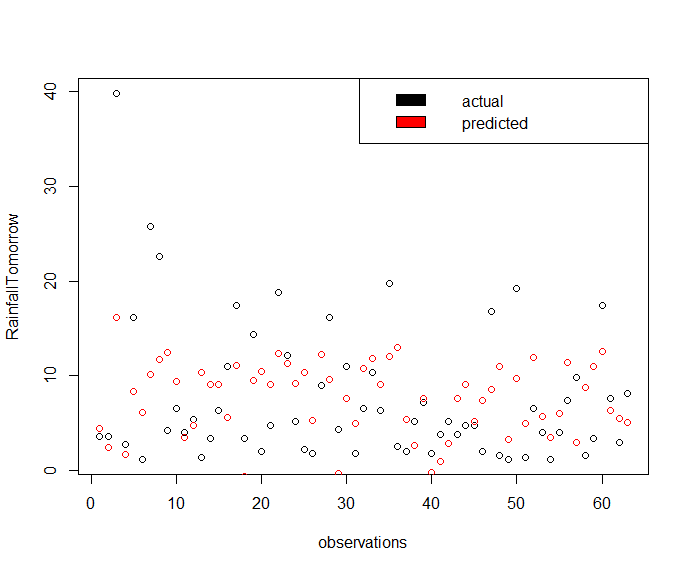
Results so far obtained allow us to predict the RainTomorrow Yes/No variable. In the first part, we highlighted that such factor variable can be put in relationship with the Rainfall quantitative one by: all.equal(weather_data$Rainfall __ 1, weather_data$RainToday == "Yes") As a consequence, we are able so ...
[Read more...]
1 5 6 7 8 9 16

Never miss an update!
Subscribe to R-bloggers to receive
e-mails with the latest R posts.
(You will not see this message again.)

Click here to close (This popup will not appear again)