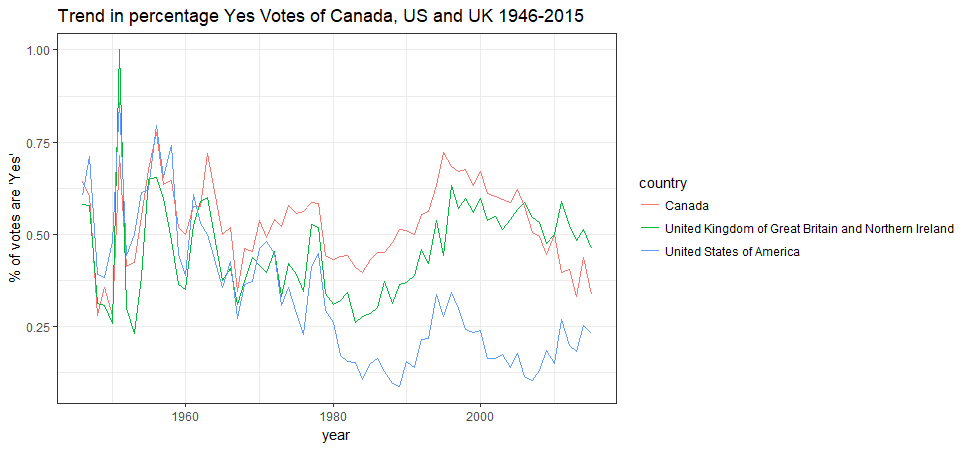
Data Visualization with googleVis exercises part 3
Scatter & Bubble chart This is the third part of our data visualization series and at this part we will explore the features of two more of the charts that googleVis provides. Read the examples below to understand the logic of what we are going to do and then test yous ... [Read more...]