January 2013

The Cluster Bootstrap

January 12, 2013 | diffuseprior

Adjusting standard errors for clustering can be a very important part of any statistical analysis. For example, duplicating a data set will reduce the standard errors dramatically despite there being no new information. I have previously dealt with this topic with reference to the linear regression model. However, in many ... [Read more...]

Getting attributes to use xts objects

January 12, 2013 | Rcpp Gallery

An earlier post illustrated that R object attributes can be set at the C++ level. Naturally, we can also read them from an object. This proves particularly useful for xts objects which are, in essence, numerical matrices with added attributed that are ... [Read more...]

Interactive SQL in R

January 12, 2013 | Jason Bryer

I recently taught a very basic introduction to SQL workshop and needed a way to have participants interact with SQL statements. Obviously there are lots of tools to interface with a database, but since we are all R users I thought it would be nice to be able interact without ... [Read more...]

Heat maps using R

January 12, 2013 | Raymond Tse

One of the great things about following blogs on R is seeing what others are doing & being able to replicate and try out things on my own data sets. For example, some great links on rapidly creating heat maps using R. Drawing Heat Maps in R How to Make a ... [Read more...]

PART – A Rule-Learning Algorithm

January 11, 2013 | statcompute

[This article was first published on Yet Another Blog in Statistical Computing » S+/R, and kindly contributed to R-bloggers]. (You can report issue about the content on this page here) Want to share your content on R-bloggers? click here if you have a blog, or here if you don't. > require('RWeka') > require('pROC') > > # SEPARATE DATA INTO TRAINING AND TESTING SETS > df1 <- read.csv('credit_count.csv') > df2 <- df1[df1$CARDHLDR == 1, 2:12] > set.seed(2013) > rows <- sample(1:nrow(df2), nrow(df2) - 1000) > set1 <- df2[rows, ] > set2 <- df2[-rows, ] > > # BUILD A PART RULE MODEL > mdl1 <- PART(factor(BAD) ~., data = set1) > print(mdl1) PART decision list ------------------ EXP_INC > 0.000774 AND AGE > 21.833334 AND INCOME > 2100 AND MAJORDRG <= 0 AND OWNRENT > 0 AND MINORDRG <= 1: 0 (2564.0/103.0) AGE > 21.25 AND EXP_INC > 0.000774 AND INCPER > 17010 AND INCOME > 1774.583333 AND MINORDRG <= 0: 0 (2278.0/129.0) AGE > 20.75 AND EXP_INC > 0.016071 AND OWNRENT > 0 AND SELFEMPL > 0 AND EXP_INC <= 0.233759 AND MINORDRG <= 1: 0 (56.0) AGE > 20.75 AND EXP_INC > 0.016071 AND SELFEMPL <= 0 AND OWNRENT > [...] [Read more...]
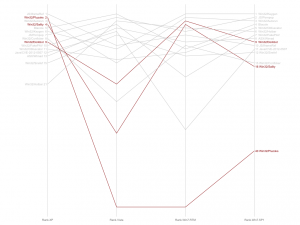
Examples of Current Major Market Clusters

January 11, 2013 | systematicinvestor

I want to follow up and provide a bit more details to the excellent “A Visual of Current Major Market Clusters” post by David Varadi. Let’s first load historical for the 10 major asset classes: Gold ( GLD ) US Dollar ( UUP ) S&P500 ( SPY ) Nasdaq100 ( QQQ ) Small Cap ( [...] [Read more...]

Slopegraphs in R

January 11, 2013 | hrbrmstr

I updated the code to use ggsave and tweaked some of the font & line size values for more consistent (and pretty) output. This also means that I really need to get this up on github. If you even remotely follow this blog, you’ll see that I’m kinda obsessed ...
[Read more...]

Mathematica adds R connectivity

January 11, 2013 | David Smith

Wolfram's Mathematica is the lastest software to add a connection to R, joining a long list of applications providing R access to their users. Mathematica 9 will use a Java-based link allow users to exchange data between Mathematica and R and to execute R code from within Mathematica. (via Ajay Ohri) [Read more...]

Simple integration with R

January 11, 2013 | Phil

[This article was first published on Just Another R Blog, and kindly contributed to R-bloggers]. (You can report issue about the content on this page here) Want to share your [Read more...]

(not provided): Using R and the Google Analytics API

January 11, 2013 | Randy Zwitch

For power users of Google Analytics, there is a heavy dose of spreadsheet work that accompanies any decent analysis.  But even with Excel in tow, it’s often difficult to get the data just right without resorting to formula hacks and manual table formatting.  This is where the Google Analytics ... [Read more...]

Shiny = Happy People

January 11, 2013 | Travis Hinkelman

The people behind the wonderful RStudio, which I gushed about in a previous post, have developed a new package, Shiny, that makes it easy to develop interactive web applications with R. Shiny is not the first package to facilitate building web apps with R (see here for comparison of Shiny ... [Read more...]

Adding Comments to CSV Files

January 11, 2013 | ivannp

Various of my R scripts produce csv files as output. For instance, I run a lengthy SVM back test, the end result is a csv file containing the indicator with some additional information. The problem is that over time one loses track what exactly the file contained and what parameters ... [Read more...]

Shiny Apps

January 11, 2013 | Jared Knowles

I have been working on developing some interactive tools for demonstrating statistical principles. The advent of the shiny framework for R from the RStudio team has made this very easy to do. These demos are still in the development... [Read more...]

Shading regions under a curve

January 11, 2013 | ucfagls

Over on the Clastic Detritus blog, Brian Romans posted a nice introduction to plotting in R. At the end of his post, Brian mentioned he would like to colour in areas under the data curve corresponding to particular ranges of … Continue reading → [Read more...]

Using Eigen for eigenvalues

January 11, 2013 | Rcpp Gallery

A previous post showed how to compute eigenvalues using the Armadillo library via RcppArmadillo. Here, we do the same using Eigen and the RcppEigen package. #include // [[Rcpp::depends(RcppEigen)]] using Eigen::Map; ... [Read more...]

Seasonal Trend Decomposition in R

January 11, 2013 | Ralph

The Seasonal Trend Decomposition using Loess (STL) is an algorithm that was developed to help to divide up a time series into three components namely: the trend, seasonality and remainder. The methodology was presented by Robert Cleveland, William Cleveland, Jean McRae and Irma Terpenning in the Journal of Official Statistics ... [Read more...]

Gauge Chart in R

January 10, 2013 | Gaston Sanchez

How to replicate a google gauge chart in R? Google charts has several options to produce nice graphics. Most of them have their equivalent function in R and can be quickly replicated, but some of them require a bit of programming. For instance, take the google gauge charts which I ... [Read more...]
1 9 10 11 12 13 17

Never miss an update!
Subscribe to R-bloggers to receive
e-mails with the latest R posts.
(You will not see this message again.)

Click here to close (This popup will not appear again)