
Weekly R-Tips: Visualizing Predictions
Want to share your content on R-bloggers? click here if you have a blog, or here if you don't.
Lets say that we estimated a linear regression model on time series data with lagged predictors. The goal is to estimate sales as a function of inventory, search volume, and media spend from two months ago. After using the lm function to perform linear regression, we predict sales using values from two month ago.
frmla <- sales ~ inventory + search_volume + media_spend
mod <- lm(frmla, data=dat)
pred = predict(mod, values, interval="predict")
If this model is estimated weekly or monthly, we will eventually want to understand how well our model did in predicting actual sales from month to month. To perform this task, we must regularly maintain a spreadsheet or data structure (RDS object) with actual predicted sales figures for each time period. That data can be used to create line graphs that visualize both the actual versus predicted values.

ggplot(mydat, aes(Month, value, group=variable, colour=variable)) +
  geom_line(lwd=1.05) + geom_point(size=2.5) +
  ggtitle("Sales (01/2010 to 05/2015)") +
  xlab("Date") + ylab("Sales") + ylim(0,30000) + xlab(" ") + ylab(" ") +
  theme(legend.title=element_blank()) + xlab(" ") +
  theme(axis.text.x=element_text(colour="black")) +
  theme(axis.text.y=element_text(colour="black")) +
  theme(legend.position=c(.4, .85))
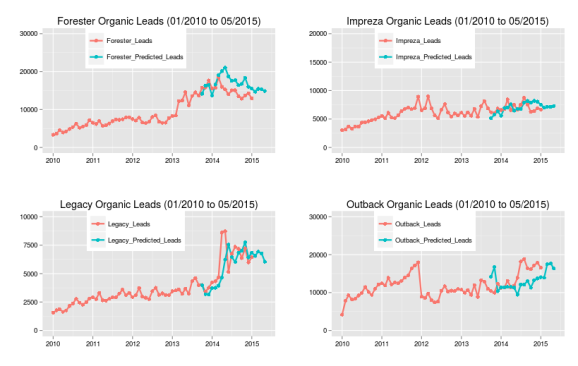
Above is an example of what the final product could look like. Visualizing predicted against actual values is an important component of evaluating the quality of a model. Furthermore, having such visualization will be of value when interacting with business audiences and “selling” your analysis.

R-bloggers.com offers daily e-mail updates about R news and tutorials about learning R and many other topics. Click here if you're looking to post or find an R/data-science job.
Want to share your content on R-bloggers? click here if you have a blog, or here if you don't.