
Two more points about crayon colors
[This article was first published on The stupidest thing... » R, and kindly contributed to R-bloggers]. (You can report issue about the content on this page here)
Want to share your content on R-bloggers? click here if you have a blog, or here if you don't.
Want to share your content on R-bloggers? click here if you have a blog, or here if you don't.
If you want to use crayon colors in R but you don’t want to rely on my R/broman package, you can just grab the code. Copy the relevant lines from the R/brocolors.R file:
crayons = c("Almond"="#efdecd",
            "Antique Brass"="#cd9575",
            "Apricot"="#fdd9b5",
            ...
            "Yellow Green"="#c5e384",
            "Yellow Orange"="#ffb653")
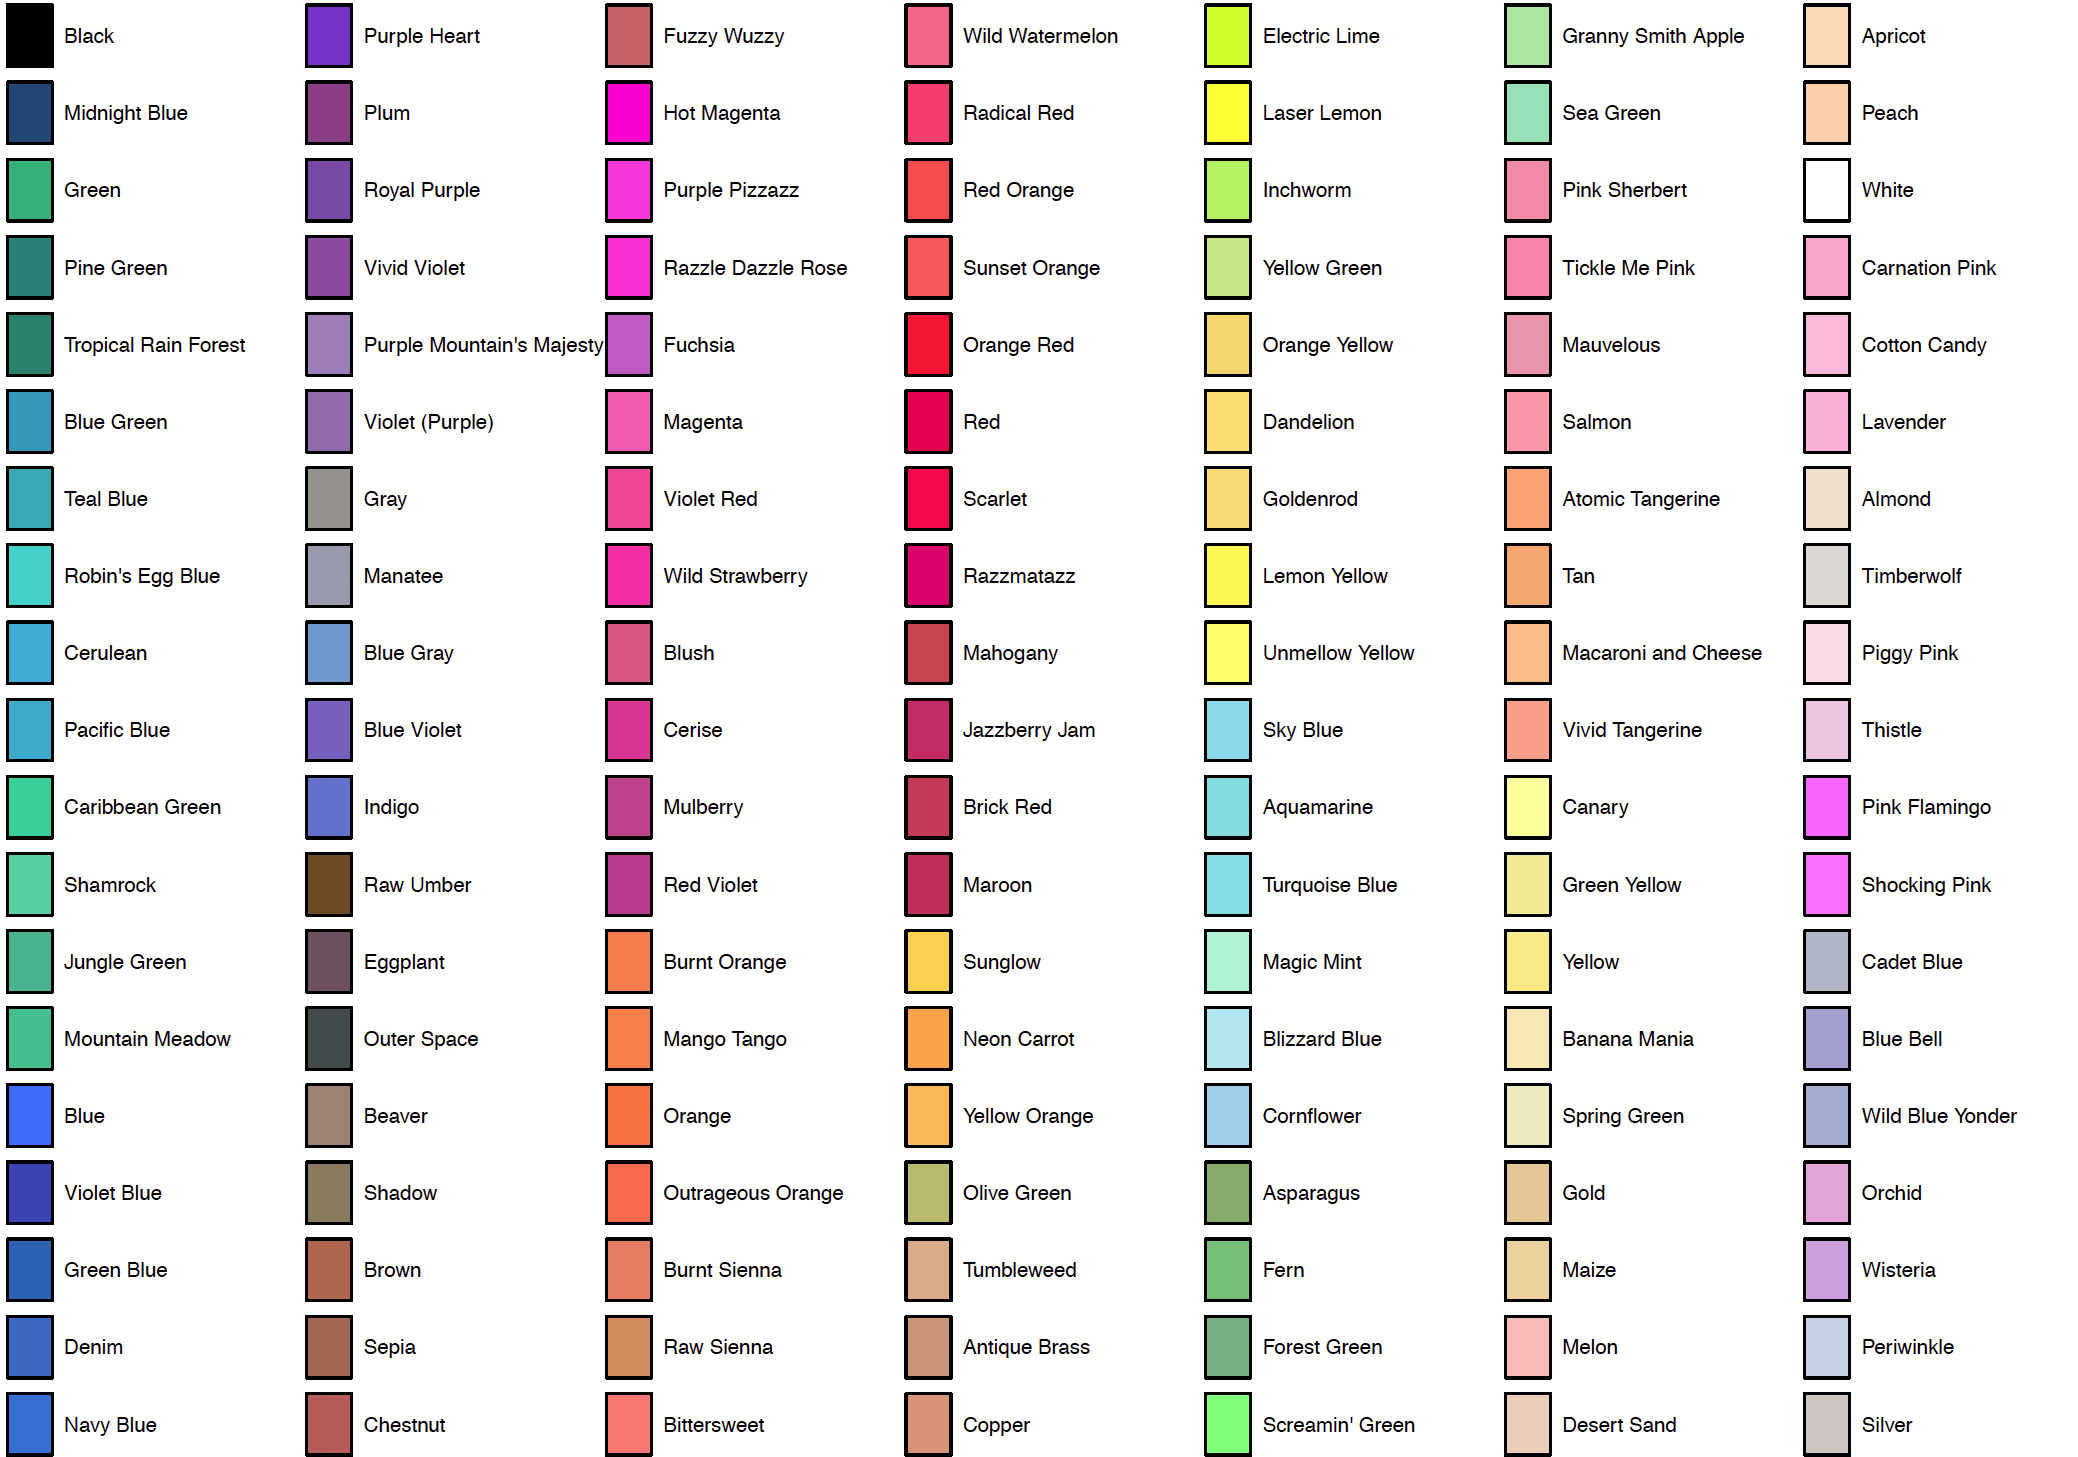
I spent a bit of time thinking about how best to sort the colors in a meaningful way, for the plot_crayons() function. But then decided to stop thinking and just do something brainless: measure distance between colors by RMS difference of the RGB values, and then use hierarchical clustering. Here’s the code from plot_crayons():
# get rgb
colval <- t(col2rgb(crayons))

# hclust to order the colors
ord <- hclust(dist(colval))$order
It’s not perfect, but I think it worked remarkably well:

To leave a comment for the author, please follow the link and comment on their blog: The stupidest thing... » R.
R-bloggers.com offers daily e-mail updates about R news and tutorials about learning R and many other topics. Click here if you're looking to post or find an R/data-science job.
Want to share your content on R-bloggers? click here if you have a blog, or here if you don't.