
Ordering categories within ggplot2 facets
Want to share your content on R-bloggers? click here if you have a blog, or here if you don't.
@drsimonj here to share my method for ordering categories within facets to create plots that look like this…

instead of like this…

Motivation: Tidy Text Mining in R
The motivation for this post comes from Tidy Text Mining in R by Julia Silge and David Robinson. It is a must read if text mining is something that interests you.
I noticed that Julia and David had left themselves a “TODO” in Chapter 5 that was “not easy to fix.” Not easy to fix? Could Julia Silge and David Robinson face challenges as the rest of us do?!

Shocking, I know.
Well, it was probably just a matter of time until they fixed it. Still, I thought it was an interesting challenge; gave it some thought, and wanted to share my solution.
The problem
They were using ggplot2 to create a bar plot with the following features:
- Facetted into separate panels
- One bar for each category (words in their case).
- Each bar category (words) can appear in one or more facet panels with different bar heights.
The problem, as you might recognize, is that varying bar heights for categories that appear in multiple facet panels makes it difficult to order the bars. Some within-facet ordering must take place, but how to do this?
Here, we’re going to roughly replicate the plot that presents this problem and then consider a potential solution.
The problem plot
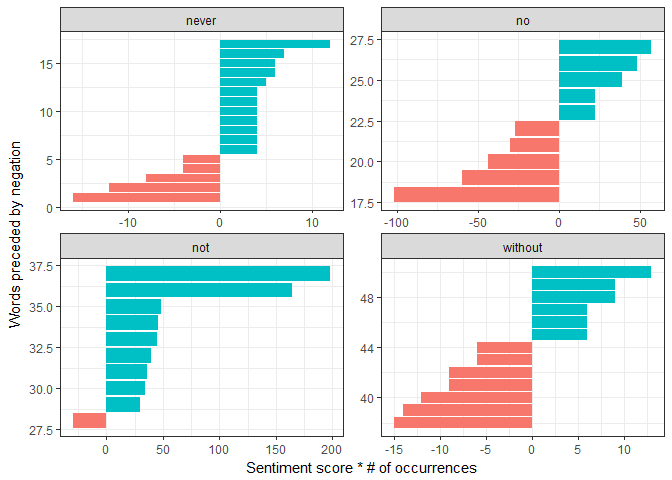
Using code from the book, the following roughly reproduces the problematic plot presented in Chapter 5 of Tidy Text Mining in R:
# Required libraries
library(dplyr)
library(tidyr)
library(ggplot2)
library(tidytext)
library(janeaustenr)

# From section 5.1: Tokenizing by n-gram
austen_bigrams <- austen_books() %>%
  unnest_tokens(bigram, text, token = "ngrams", n = 2)

# From section 5.1.1: Counting and filtering n-grams
bigrams_separated <- austen_bigrams %>%
  separate(bigram, c("word1", "word2"), sep = " ")


# From section 5.1.3: Using bigrams to provide context in sentiment analysis
AFINN <- get_sentiments("afinn")
negation_words <- c("not", "no", "never", "without")

negated_words <- bigrams_separated %>%
  filter(word1 %in% negation_words) %>%
  inner_join(AFINN, by = c(word2 = "word")) %>%
  count(word1, word2, score, sort = TRUE) %>%
  ungroup()

# Create plot
negated_words %>%
  mutate(contribution = n * score) %>%
  mutate(word2 = reorder(word2, contribution)) %>%
  group_by(word1) %>%
  top_n(10, abs(contribution)) %>%
  ggplot(aes(word2, contribution, fill = n * score > 0)) +
    geom_bar(stat = "identity", show.legend = FALSE) +
    facet_wrap(~ word1, scales = "free") +
    xlab("Words preceded by negation") +
    ylab("Sentiment score * # of occurrences") +
    theme_bw() +
    coord_flip()

This plot shows the words that are influencing the sentiment analysis of Jane Austen’s books but frequently preceded with the negation words “never,” “no,” “not,” or “without.” For example, Julia and David make the following conclusion based on the “not” facet:
The bigrams “not like” and “not help” were overwhelmingly the largest causes of misidentification, making the text seem much more positive than it is.
While the content is fascinating, our challenge is more general: to fix the ordering of the bars within each facet.
How to order within facets
When the data is prepared for plotting (code repeated below), the use of reorder is doing some ordering for us, but doesn’t produce a perfect result because of the facetting problem.
negated_words %>%
  mutate(contribution = n * score) %>%
  # ----- >
  # This line does some reordering
  # but not perfect
  mutate(word2 = reorder(word2, contribution)) %>%
  # < -----
  group_by(word1) %>%
  top_n(10, abs(contribution))
To overcome this, my first temptation was to try arranging the data within facets as a grouped data frame. However, this didn’t get me very far.
Instead, we can order the entire data set as follows:
-
ungroupthe data. arrangethe data by:- The variable for facet groups (
word1) - The variable for bar heights (
contribution)
- The variable for facet groups (
Keep track of this new arrangement with an
ordercolumn of therow_number.
Let’s do this and save the results:
# Plot Data Frame
pd <- negated_words %>%
  mutate(contribution = n * score) %>%
  group_by(word1) %>%
  top_n(10, abs(contribution)) %>%
  # 1. Remove grouping
  ungroup() %>%
  # 2. Arrange by
  #   i.  facet group
  #   ii. bar height
  arrange(word1, contribution) %>%
  # 3. Add order column of row numbers
  mutate(order = row_number())

pd
#> # A tibble: 50 × 6
#>    word1    word2 score     n contribution order
#>    <chr>    <chr> <int> <int>        <int> <int>
#> 1  never   failed    -2     8          -16     1
#> 2  never   forget    -1    12          -12     2
#> 3  never  failing    -2     4           -8     3
#> 4  never disgrace    -2     2           -4     4
#> 5  never    tired    -2     2           -4     5
#> 6  never    agree     1     4            4     6
#> 7  never  consent     2     2            4     7
#> 8  never     hope     2     2            4     8
#> 9  never     like     2     2            4     9
#> 10 never    worth     2     2            4    10
#> # ... with 40 more rows
This orders the entire data frame, but also orders the categories (words) within each facet group!
To demonstrate, let’s plot the results with order on the x-axis and without freeing the facet scales:
ggplot(pd, aes(order, contribution, fill = n * score > 0)) +
  geom_bar(stat = "identity", show.legend = FALSE) +
  facet_wrap(~ word1) +
  xlab("Words preceded by negation") +
  ylab("Sentiment score * # of occurrences") +
  theme_bw() +
  coord_flip()

See how we’ve accurately ordered the bars within each facet. The only thing is that the “starting point” is not 1 (except for the first facet). By freeing the scales again, we can properly focus each facet.
ggplot(pd, aes(order, contribution, fill = n * score > 0)) +
  geom_bar(stat = "identity", show.legend = FALSE) +
  # Free the scales here
  facet_wrap(~ word1, scales = "free") +
  xlab("Words preceded by negation") +
  ylab("Sentiment score * # of occurrences") +
  theme_bw() +
  coord_flip()
Adding categories to the axis
The last piece of the puzzle is to replace the numeric values on each x-axis with the appropriate word. We can do this using scale_x_continuous to replace the order number with the corresponding category (word2) in the row. Aside, we’re controlling the x-axis, but the words appear on the y-axis because we’re using coord_flip.
ggplot(pd, aes(order, contribution, fill = n * score > 0)) +
  geom_bar(stat = "identity", show.legend = FALSE) +
  facet_wrap(~ word1, scales = "free") +
  xlab("Words preceded by negation") +
  ylab("Sentiment score * # of occurrences") +
  theme_bw() +
  # Add categories to axis
  scale_x_continuous(
    breaks = pd$order,
    labels = pd$word2,
    expand = c(0,0)
  ) +
  coord_flip()

Et voilà!
TODO
Before publishing this post, I sent a draft to Julia and David for comments. My sincerest thanks to them for taking the time to read it!
David also made the great suggestion to encapsulate this method into a function or add a new “stat” option to geom_bar to handle this automatically. I’ll be opening an issue about this on the ggplot2 GitHub page and playing around to see what works best.
How good is open source 🙂
Sign off
Thanks for reading and I hope this was useful for you.
For updates of recent blog posts, follow @drsimonj on Twitter, or email me at [email protected] to get in touch.
If you’d like the code that produced this blog, check out the blogR GitHub repository.
R-bloggers.com offers daily e-mail updates about R news and tutorials about learning R and many other topics. Click here if you're looking to post or find an R/data-science job.
Want to share your content on R-bloggers? click here if you have a blog, or here if you don't.