Articles by Statistical Aid

MANOVA(Multivariate Analysis of Variance) using R

November 22, 2021 | Statistical Aid

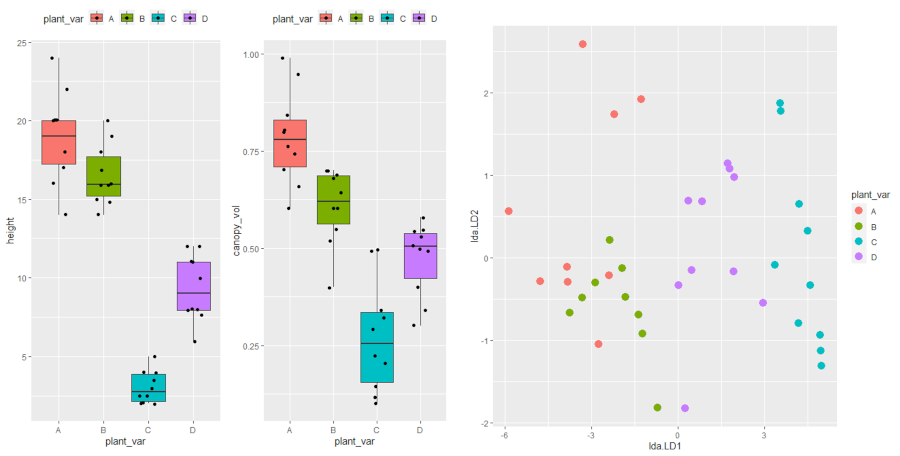
What is MANOVA (Multivariate Analysis of Variance)? MANOVA is an extension to univariate ANOVA that includes at least two dependent variables to analyze differences between multiple groups in the independent variable. In contrast to ANOVA, where we compare individual group means, MANOVA compares the vectors… The post MANOVA(Multivariate Analysis ...
[Read more...]

Analysis of Covariance (ANCOVA) using R

October 31, 2021 | Statistical Aid

A general linear model (GLM) with at least one continuous and one categorical independent variable is known as ANCOVA (treatments). When the effect of treatments is essential and there is an additional continuous variable in the study, ANCOVA is effective.… The post Analysis of Covariance (ANCOVA) using R appeared first ...
[Read more...]

One Sample T-test in R

October 26, 2021 | Statistical Aid

A one-sample t-test is used to see if the mean of a population from which a sample was taken differs statistically from a hypothesised value. The null hypothesis in a t-test is that the population mean is equal to the… The post One Sample T-test in R appeared first on ...
[Read more...]

Pearson correlation in R

October 26, 2021 | Statistical Aid

The Pearson correlation coefficient, sometimes known as Pearson’s r, is a statistic that determines how closely two variables are related. Its value ranges from -1 to +1, with 0 denoting no linear correlation, -1 denoting a perfect negative linear correlation,… The post Pearson correlation in R appeared first on Statistical Aid: ...
[Read more...]

Chi-Square test using R

October 26, 2021 | Statistical Aid

A chi-square test is used to analyze nominal (sometimes known as categorical) data. It is pronounced kai and is frequently written as a χ2 test. It’s used to compare the observed frequencies in each sample’s response categories. The null hypothesis… The post Chi-Square test using R appeared first on ...
[Read more...]

Random Forest in R

October 22, 2021 | Statistical Aid

Random Forest is a strong ensemble learning method that may be used to solve a wide range of prediction problems, including classification and regression. Because the method is based on an ensemble of decision trees, it offers all of the… The post Random Forest in R appeared first on Statistical ...
[Read more...]

Paired sample t-test using R

October 5, 2021 | Statistical Aid

The paired sample t-test, sometimes called the dependent sample t-test, is a statistical procedure used to determine whether the mean difference between two sets of observations is zero. In a paired sample t-test, each subject or entity is measured twice, resulting… The post Paired sample t-test using R appeared first ...
[Read more...]

One-Way ANOVA using R

October 5, 2021 | Statistical Aid

The one-way analysis of variance (ANOVA) is used to determine whether there are any statistically significant differences between the means of three or more independent (unrelated) groups. This guide will provide a brief introduction to the one-way ANOVA, including the… The post One-Way ANOVA using R appeared first on Statistical ...
[Read more...]

Two-Way ANOVA using R

October 5, 2021 | Statistical Aid

A two-way ANOVA test is a statistical test used to determine the effect of two nominal predictor variables on a continuous outcome variable. A two-way ANOVA tests the effect of two independent variables on a dependent variable. This blog post contains… The post Two-Way ANOVA using R appeared first on ...
[Read more...]

Cluster analysis using R

October 5, 2021 | Statistical Aid

Cluster analysis is a statistical technique that groups similar observations into clusters based on their characteristics. It is a statistical method of processing data. A good cluster analysis produces high-quality clusters with high inter-class correlation. This blogpost contains the following… The post Cluster analysis using R appeared first on Statistical ...
[Read more...]

Principal Component Analysis (PCA) using R

September 28, 2021 | Statistical Aid

PCA means Principal Component Analysis. PCA is a multivariate technique that is used to reduce the dimension of a data set. More precisely, PCA is concerned with explaining the variance-covariance structure through a few linear combinations of the original variables.… The post Principal Component Analysis (PCA) using R appeared first ...
[Read more...]

Never miss an update!
Subscribe to R-bloggers to receive
e-mails with the latest R posts.
(You will not see this message again.)

Click here to close (This popup will not appear again)