Articles by jyothi

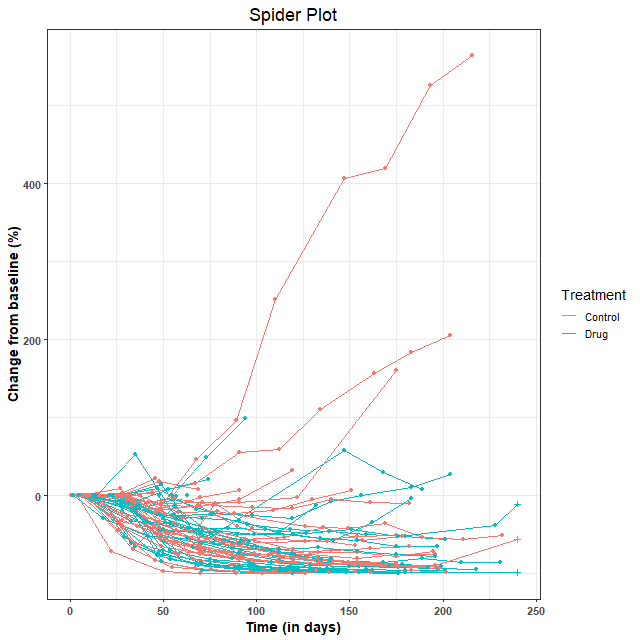
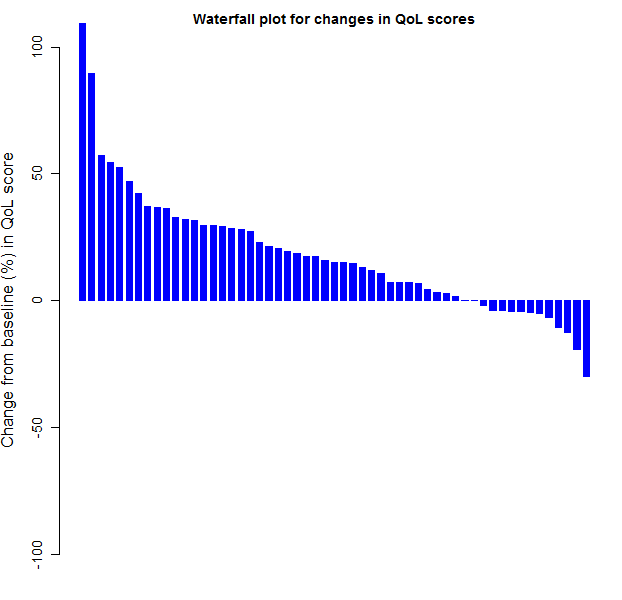
Visualization of Tumor Response – Spider Plots

August 28, 2018 | jyothi

A collection of some commonly used and some newly developed methods for the visualization of outcomes in oncology studies include Kaplan-Meier curves, forest plots, funnel plots, violin plots, waterfall plots, spider plots, swimmer plot, heatmaps, circos plots, transit map diagrams and network analysis diagrams (reviewed here). Previous articles in this ...
[Read more...]

Forest Plot (with Horizontal Bands)

July 2, 2016 | jyothi

Forest plots are often used in clinical trial reports to show differences in the estimated treatment effect(s) across various patient subgroups. See, for example a review. The page on Clinical Trials Safety Graphics includes a SAS code for a forest plot that depicts the hazard ratios for various patient ... [Read more...]

Manipulate(d) Regression!

May 5, 2016 | jyothi

The R package ‘manipulate’ can be used to create interactive plots in RStudio. Though not as versatile as the ‘shiny’ package, ‘manipulate’ can be used to quickly add interactive elements to standard R plots. This can prove useful for demonstrating statistical concepts, especially to a non-statistician audience. The R code ...
[Read more...]

A Visualization of World Cuisines

December 28, 2015 | jyothi

In a previous post, we had ‘mapped’ the culinary diversity in India through a visualization of food consumption patterns. Since then, one of the topics in my to-do list was a visualization of world cuisines. The primary question was similar to that asked of the Indian cuisine: Are cuisines of ...
[Read more...]

Celebrating one year of blogging with a word cloud

November 20, 2015 | jyothi

This month marks the one year anniversary of Design Data Decisions! To celebrate, I decided to do a ‘visual display’ of this blog by creating a word cloud out of articles posted thus far. Using R. This task turned out to be very easy, because of a cool word cloud ...
[Read more...]

Drug Interaction Studies – Statistical Analysis

September 22, 2015 | jyothi

This post is actually a continuation of the previous post, and is motivated by this article that discusses the graphics and statistical analysis for a two treatment, two period, two sequence (2x2x2) crossover drug interaction study of a new treatment versus the standard. Whereas the previous post was devoted ...
[Read more...]

Spaghetti plots with ggplot2 and ggvis

August 19, 2015 | jyothi

This post was motivated by this article that discusses the graphics and statistical analysis for a two treatment, two period, two sequence (2x2x2) crossover drug interaction study of a new drug versus the standard. I wanted to write about implementing those graphics and the statistical analysis in R. This ...
[Read more...]

Waterfall plots – what and how?

July 23, 2015 | jyothi

“Waterfall plots” are nowadays often used in oncology clinical trials for a graphical representation of the quantitative response of each subject to treatment. For an informative article explaining waterfall plots see Understanding Waterfall Plots. In this post, we illustrate the creation of waterfall plots in R. In a typical waterfall ...
[Read more...]

Graphical presentation of data, best practices

June 30, 2015 | jyothi

Show the data, don’t conceal them was the first article from a series of articles published in the British Journal of Pharmacology that deals with the best practices to be followed in statistical reporting. The current set of articles in this series can be obtained at http://onlinelibrary.wiley.... [Read more...]

Graphs in R – Overlaying Data Summaries in Dotplots

June 9, 2015 | jyothi

Dotplots are useful for the graphical visualization of small to medium-sized datasets. These simple plots provide an overview of how the data is distributed, whilst also showing the individual observations. It is however possible to make the simple dotplots more informative by overlaying them with data summaries and/or smooth ...
[Read more...]

A short post: A Shiny Application for Visualizing Colors in R

December 16, 2014 | jyothi

Choosing the right colors for graphics is vital for good data visualization. There are 657 colors defined in R using color names. The names of these colors can be obtained using the R command: Some examples of color names in R include exotic sounding ones such as ‘steelblue1′, ‘thistle’, ‘mintcream’ and ... [Read more...]

Never miss an update!
Subscribe to R-bloggers to receive
e-mails with the latest R posts.
(You will not see this message again.)

Click here to close (This popup will not appear again)