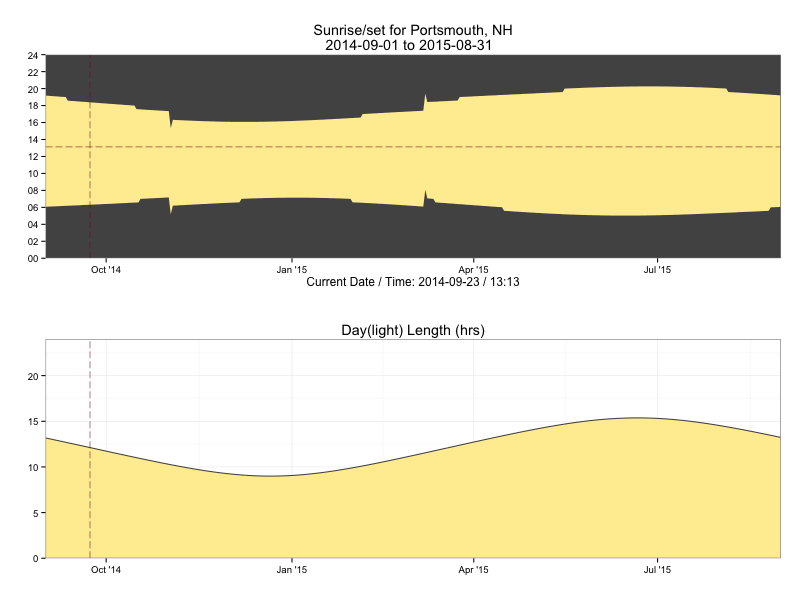
Articles by hrbrmstr

SHODAN API in R (With Examples)

January 17, 2013 | hrbrmstr

Folks may debate the merits of the SHODAN tool, but in my opinion it’s a valuable resource, especially if used for “good”. What is SHODAN? I think ThreatPost summed it up nicely: “Shodan is a Web based search engine that discovers Internet facing computers, including desktops, servers and routers. ...
[Read more...]

How Low Can It [The Mississsippi River] Go?

January 12, 2013 | hrbrmstr

I’ve heard quite a bit about the current problems with the Mississippi River and wanted to see for myself (with data) just how bad it is. St Louis seems to be quite indicative of the severity of the situation, so I pulled the USGS “stream” records for it and ...
[Read more...]

Slopegraphs in R

January 11, 2013 | hrbrmstr

I updated the code to use ggsave and tweaked some of the font & line size values for more consistent (and pretty) output. This also means that I really need to get this up on github. If you even remotely follow this blog, you’ll see that I’m kinda obsessed ...
[Read more...]

Forbes Graph Makeover Contest Entry #1

December 5, 2012 | hrbrmstr

Naomi Robbins is running a graph makeover challenge over at her Forbes blog and this is my entry for the B2B/B2C Traffic Sources one (click for larger version): And, here’s the R source for how to generate it: library(ggplot2)   df = read.csv("b2bb2c....
[Read more...]

‘Sandy’ Code Up On Github

October 29, 2012 | hrbrmstr

UPDATE: As indicated in the code comments, Google took down the cone KML files. I’ll be changing the code to use the NHC archived cone files later tonight I will (most likely) not be littering the blog with any more updates to the ‘Sandy’ code unless they are really ...
[Read more...]

Watch Sandy in “R” (Including Forecast Cone)

October 28, 2012 | hrbrmstr

As indicated in the code comments, Google took down the cone KML files. I’ll be changing the code to use the NHC archived cone files later tonight NOTE: There is significantly updated code on github for the Sandy ‘R’ dataviz. This is a follow-up post to the quickly crafted ...
[Read more...]

Watch “Sandy” In R

October 27, 2012 | hrbrmstr

UPDATE: Significantly updated code on githubWell, a couple folks asked how to make it more “centered” on the hurricane and stop the labels from chopping off, so I modified the previous code a bit to show how to do that. As indicated in the code comments, Google took down the ...
[Read more...]

Get an R Data Frame from a MongoDB Query

October 22, 2012 | hrbrmstr

There’s a good FAQ on how to do the MongoDB query -__ R data frame but I wanted to post a more complete example that included the database connection and query setup since I suspect there are folks new to Mongo who would appreciate the end-to-end view. The code ... [Read more...]

DIY ZeroAccess GeoIP Analysis : So What?

October 8, 2012 | hrbrmstr

NOTE: A great deal of this post comes from @jayjacobs as he took a conversation we were having about thoughts on ways to look at the data and just ran like the Flash with it. Did you know that – if you’re a US citizen – you have approximately a 1 in 5 ...
[Read more...]

DIY ZeroAccess GeoIP Plots

October 5, 2012 | hrbrmstr

Since F-Secure was #spiffy enough to provide us with GeoIP data for mapping the scope of the ZeroAccess botnet, I thought that some aspiring infosec data scientists might want to see how to use something besides Google Maps & Google Earth to view the data. If you look at the CSV ...
[Read more...]

ThinkStats … in R :: Example 1.3

March 7, 2012 | hrbrmstr

With 1.2 under our belts, we go now to the example in section 1.3 which was designed to show us how to partition a larger set of data into subsets for analysis. In this case, we’re going to jump to example 1.3.2 to determine the number of live births. While the Python ... [Read more...]

ThinkStats … in R (including Example 1.2)

March 4, 2012 | hrbrmstr

ThinkStats (by Allen B. Downey) is a good book to get you familiar with statistics (and even Python, if you’ve done some scripting in other languages). I thought it would be interesting to present some of the examples & exercises in the book in R. Why? Well, once you’ve ... [Read more...]
1 19 20 21

Never miss an update!
Subscribe to R-bloggers to receive
e-mails with the latest R posts.
(You will not see this message again.)

Click here to close (This popup will not appear again)