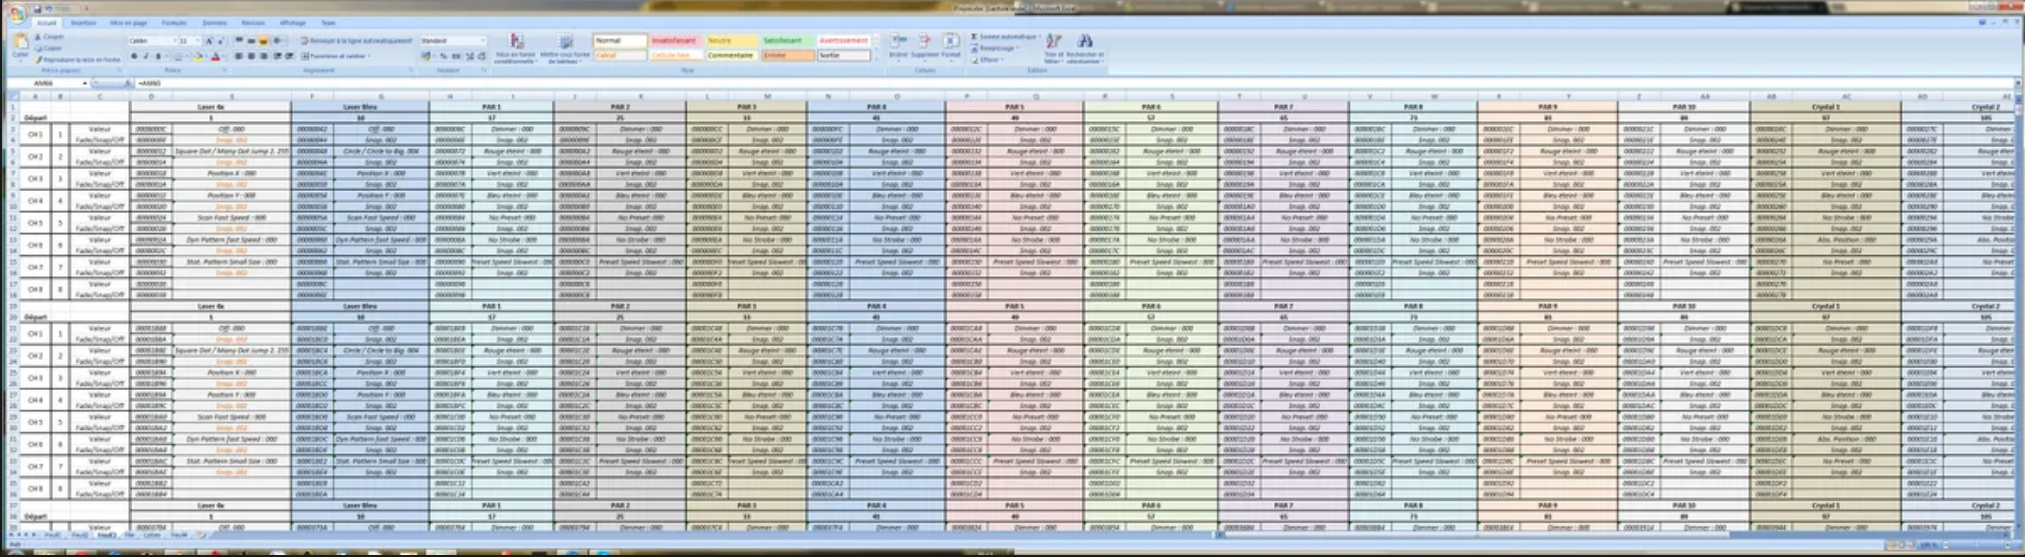
tl;dr
This blog post is going to be long, and deal with many topics. But I think you’re going to enjoy
it. So get a hot beverage and relax. Take the time to read. We don’t take enough time to read
anymore. It’s a shame.
But ...
This blog post is based on an article I’m currently working on which you can find
here. Contributions more than welcome!
“You expect me to read all this?”
The gist of this blog post can be summarised in the following sentence:
lagged positive cases of the neighbouring regions of ...
In this blog post, I want to discuss something that I, personally, have never seen discussed; how to create
a “serverless” (or “shinyless” you could say) dashboard using R.
I made one dashboard like that, which you can find here.
This dashboard is running on a simple, standard web server. ...
I’m currently working on a preprint on the spread of COVID-19 in Luxembourg. My hypothesis is that
landlocked countries, especially ones like Luxembourg that have very close ties to their neighbours
have a very hard time controlling the pandemic, unlike island countries which can completely close
off their borders, ...
Introduction
I was able to blog during the year 2020 without mentioning the ongoing pandemic once. It’s not that I made
any conscious effort not to talk about it, but I did not really want to do something that had already
been done a 1000 tim... [Read more...]
This blog post just contains the links I mention in my video that you can watch here.
I mention the following books, packages, and people in my video:
echarts4r targets easystats Applied Economics with R coolbutuseless Data Science ZJ and disk.frame S... [Read more...]
This blog post just contains the links I mention in my video that you can watch here.
I mention the following books, packages, and people in my video:
echarts4r
targets
easystats
Applied Economics with R
coolbutuseless
Data Science ZJ and disk.frame
Statistical Rethinking
Golem and Engineering production-grade shiny ...
This blog post just contains the links I mention in my video that you can watch here.
I mention the following books, packages, and people in my video:
echarts4r
targets
easystats
Applied Economics with R
coolbutuseless
Data Science ZJ and disk.frame
Statistical Rethinking
Golem and Engineering production-grade shiny ... [Read more...]
Note: if you’re reading this and images are not showing, visit the original post on my blog. The blog post contains interactive plots which help in understanding the point I’m making.
I’ve recently come across this graph (on Twitter) from the Economist... [Read more...]
Note: if you’re reading this and images are not showing, visit the original post on my blog. The
blog post contains interactive plots which help in understanding the point I’m making.
I’ve recently come across this graph (on Twitter) from the Economist:
You can read the article ... [Read more...]
Note: if you’re reading this and images are not showing, visit the original post on my blog. The
blog post contains interactive plots which help in understanding the point I’m making.
I’ve recently come across this graph (on Twitter) from the Economist:
You can read the article ... [Read more...]
A little trick I thought about this week; using Google Sheets, which includes a “googletranslate()” function to translate a survey that we’re preparing at work, from French to English, and using R of course. You’ll need a Google account for this. Also,... [Read more...]
A little trick I thought about this week; using Google Sheets, which includes a “googletranslate()”
function to translate a survey that we’re preparing at work, from French to English, and using
R of course. You’ll need a Google account for this. Also, keep in mind that you’ll ... [Read more...]
A little trick I thought about this week; using Google Sheets, which includes a “googletranslate()”
function to translate a survey that we’re preparing at work, from French to English, and using
R of course. You’ll need a Google account for this. Also, keep in mind that you’ll ... [Read more...]
Some weeks ago I tweeted this:
GUIs were a mistake
— Bruno Rodrigues (@brodriguesco) October 9, 2020
you might think that I tweeted this as an unfunny joke, but it’s not. GUIs were one of the worst
things to happen for statisticians. Clickable interfaces for data analysis is probably one of the
... [Read more...]
Some weeks ago I tweeted this:
GUIs were a mistake
— Bruno Rodrigues (@brodriguesco) October 9, 2020
you might think that I tweeted this as an unfunny joke, but it’s not. GUIs were one of the worst
things to happen for statisticians. Clickable interfaces for data analysis is probably one of the
...
The “Data Scientist” label served its purpose; it allowed us to signal a transition happening in
our profession from using only applied mathematical statistical methods to something else, which
now also involves the use of a subset of software engineering practices. This transition was
mentioned back in 2010 by Deborah Nolan
(... [Read more...]
The “Data Scientist” label served its purpose; it allowed us to signal a transition happening in
our profession from using only applied mathematical statistical methods to something else, which
now also involves the use of a subset of software engineering practices. This transition was
mentioned back in 2010 by Deborah Nolan
(...
In my previous blog post I showed you
how I set up my own Shiny server using a Raspberry Pi 4B. If you visited the following
link you’ll be connecting to my
Raspberry Pi and can play around with a Shiny app that I called golemDemo.
It’s been ... [Read more...]
In my previous blog post I showed you
how I set up my own Shiny server using a Raspberry Pi 4B. If you visited the following
link you’ll be connecting to my
Raspberry Pi and can play around with a Shiny app that I called golemDemo.
It’s been ...