
An Introduction to Reproducible Analyses in R
Want to share your content on R-bloggers? click here if you have a blog, or here if you don't.
Earlier this week I had a lot of fun running a one-day workshop for the Royal Society of Biology titled “An Introduction to Reproducible Analyses in R”.
It was intended to introduce researchers at all stages of their careers to using R to make their analyses and figures more reproducible.
We ran the course because an increase in the complexity and scale of biological data means biologists are increasingly required to develop the data skills needed to design reproducible workflows for the simulation, collection, organisation, processing, analysis and presentation of data. I believe developing such data skills requires at least some coding which makes your work (everything you do with your raw data) explicitly described, totally transparent and completely reproducible. However, learning to code can be a daunting prospect for many biologists! That’s why an “Introduction to reproducible analyses in R” was developed.
During the course I asked (with google forms) some questions about their current working practices. I always gave an ‘Other’ option. These were the responses.
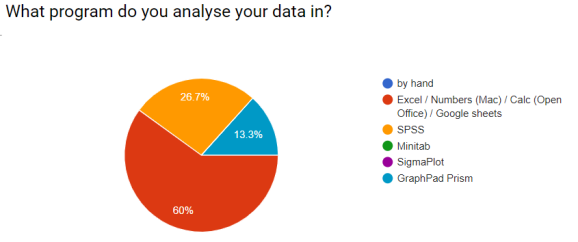
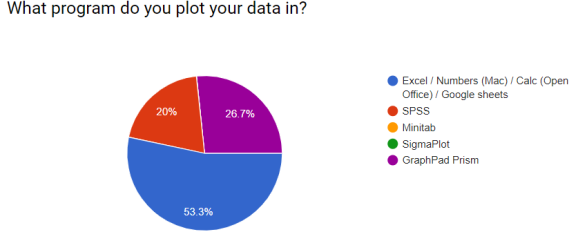
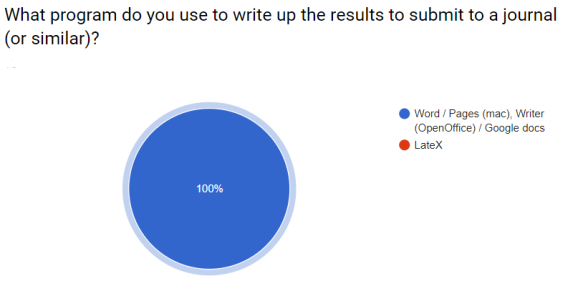
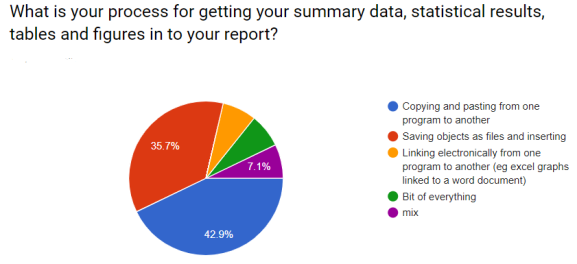
I hoped to demonstrate that workflows could be simpler and more efficient!
No previous coding experience was assumed.
You can get all the slides here
The Learning Outcomes were:
After this workshop the successful learner will be able to:
- Find their way around the RStudio windows
- Create and plot data using the base package and ggplot
- Explain the rationale for scripting analysis
- Use the help pages
- Know how to make additional packages available in an R session
- Reproducibly Import data in a variety of formats
- Understand what is meant by the working directory, absolute and relative paths and be able to apply these concepts to data import
- Summarise data in a single group or in multiple groups
- Recognise tidy data format and carry out some typical data tidying tasks
- Develop highly organised analyses including well-commented scripts that can be understood by future you and others
- Use markdown to produce reproducible analyses, figures and reports
The participants worked hard and came a long way in just a few hours. It was fun to meet them and I hope they are able take some of the skills back into their research-practice.
R-bloggers.com offers daily e-mail updates about R news and tutorials about learning R and many other topics. Click here if you're looking to post or find an R/data-science job.
Want to share your content on R-bloggers? click here if you have a blog, or here if you don't.