April 2023

flextable supports RTF

April 4, 2023 | ArData

Usages The table for the illustration Preparation The flextable Annotations RTF generation Version 0.9 of the ‘flextable’ package adds the possibility to produce tables in RTF documents. This format is rare but mandatory for some communities, i.e. mainly in the pharmaceutical industry to our knowledge. Usages Two methods can be ... [Read more...]

30 Day Chart Challenge- Endangered Species

April 3, 2023 | Louise E. Sinks

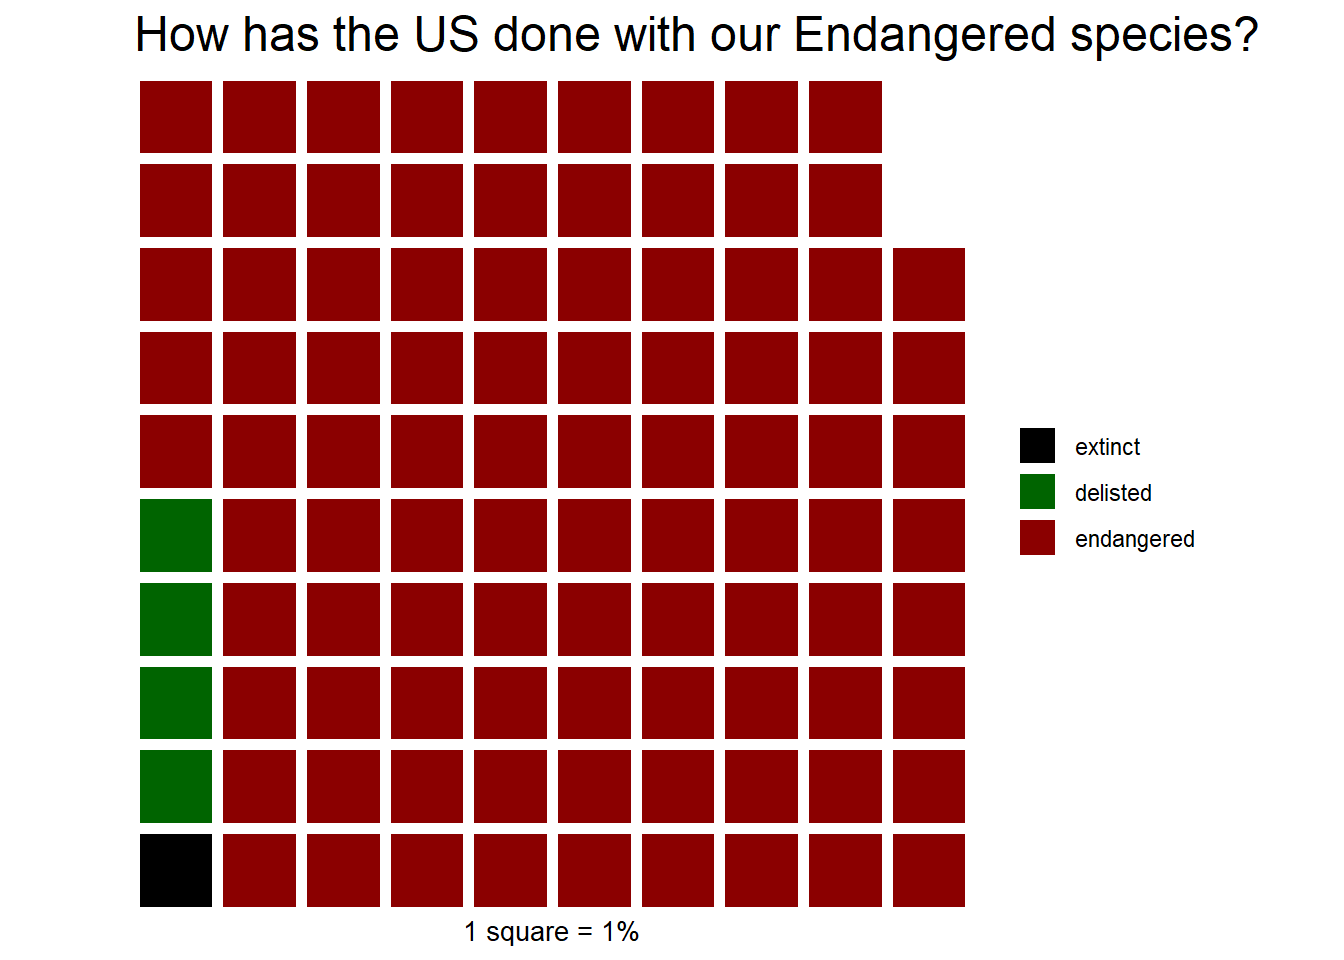
It is Day 4 of the #30DayChartChallenge. More info can be found at the challenge’s Github page. Today’s theme is history. But this is a subtheme of “comparisions”, so I’d like to avoid doing a simple time series. I decided to look at the endangered species list the ...
[Read more...]

Recent advances in extreme value theory

April 3, 2023 | YoungStatS

Recent advances in extreme value theory Thursday, April 20th, 6:00 PT / 9:00 ET / 15:00 CET Extreme value theory is concerned with the accurate statistical assessment of the risk of rare events. Such extreme events have small occurrence probabiliti...
[Read more...]

How to Modify Variables the Right Way in R

April 3, 2023 | R | TypeThePipe

Introduction In data analysis and data science, it’s common to work with large datasets that require some form of manipulation to be useful. In this small article, we’ll explore how to create and modify columns in a dataframe using modern R tools from the tidyverse package. We can ...
[Read more...]

30 Day Chart Challenge- Flora and Fauna

April 2, 2023 | Louise E. Sinks

It is Day 3 of the #30DayChartChallenge. More info can be found at the challenge’s Github page. Today’s theme is flora and fauna. I found a trove of fascinating data at Global Assessment of Reptile Distributions. I chose the dataset on body size/ mass from the paper: “Different solutions ...
[Read more...]

Polyglot Exploration of Function Overloading

April 2, 2023 | Jonathan Carroll

I’ve been working my way through Exercism exercises in a variety of languages because I strongly believe every language you learn something about teaches you about all the others you know, and makes for useful comparisons between what features they offer. I was1 Learning Me a Haskell for Great ... [Read more...]

flextable for ‘Grid graphics’

April 2, 2023 | ArData

Export table as png Function gen_grob Simple usage The resizing options Content wrapping One of the great features of the flextable package is the ability to work with ‘Grid graphics’ format. The gen_grob() function generates a grob (Graphical Object) from a flextable, which can then be added to ...
[Read more...]

30 Day Chart Challenge -Arlington Parks

April 1, 2023 | Louise E. Sinks

When I looked at Twitter this morning, my feed was filled with amazing charts. Apparently, April is month for the #30DayChartChallenge. More info can be found at the challenge’s Github page. Each day, the challenge specifies a type of chart, but n...
[Read more...]

Trade Classification in R with PINstimation

April 1, 2023 | PINstimation

The use of high-frequency data has gained widespread attention and popularity in contemporary financial research thanks to its potential to capture minute fluctuations and provide detailed insights into the behavior of financial markets. However, analy...
[Read more...]
1 5 6 7

Never miss an update!
Subscribe to R-bloggers to receive
e-mails with the latest R posts.
(You will not see this message again.)

Click here to close (This popup will not appear again)