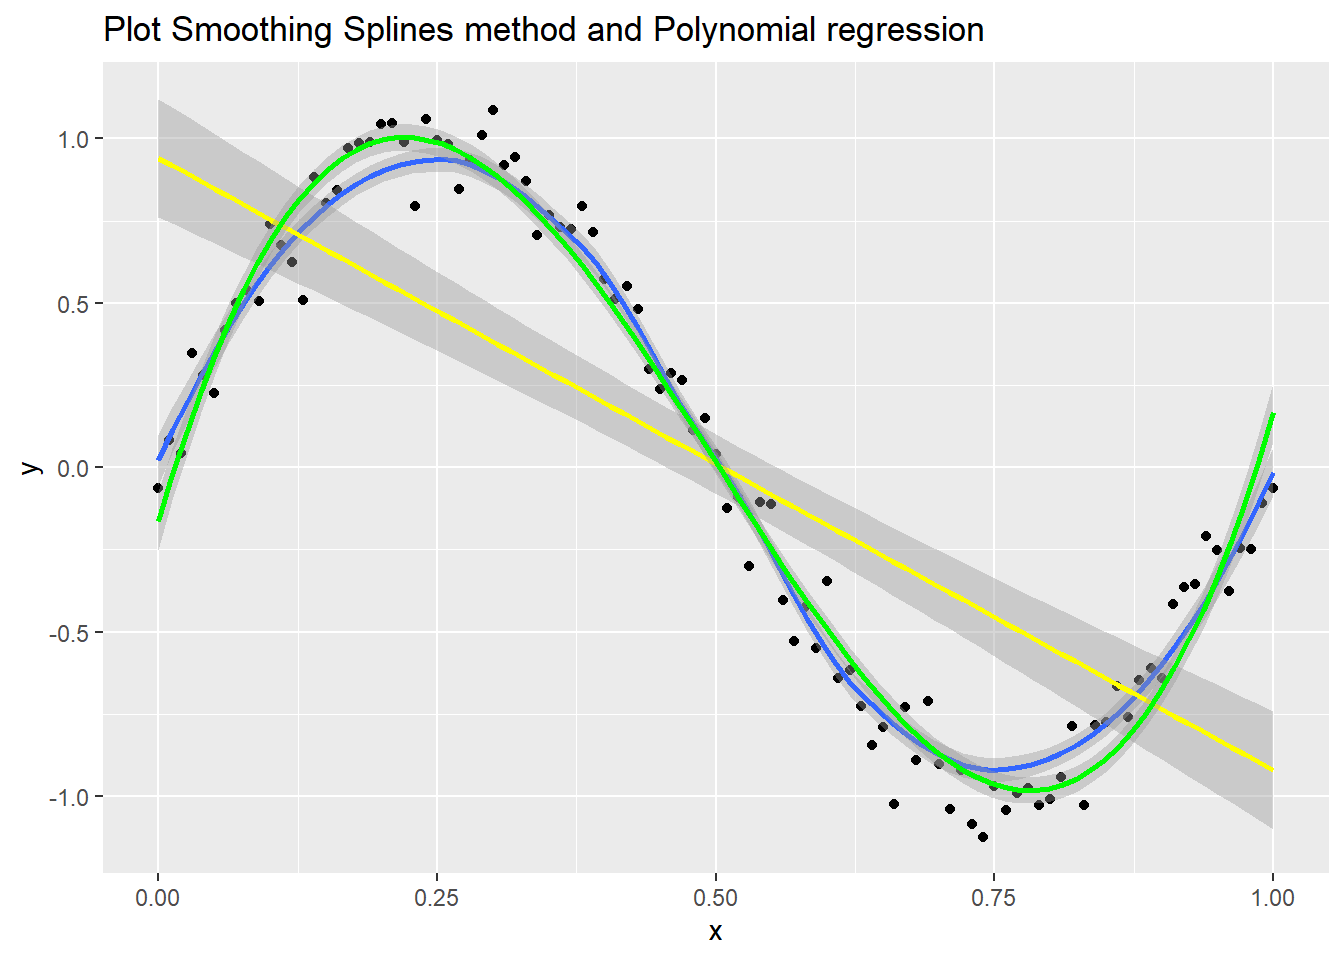
Articles by R | TypeThePipe

Analyzing Remote Work in European Countries

June 13, 2021 | R | TypeThePipe

1. Data downloading As we always do, we are going to connect and download the desired data. In this case, our data source is the Eurostat. We download and read the data file. library(tidyverse) download.file("https://ec.europa.eu/eurostat/api/dissemination/sdmx/2.1/data/LFSA_EHOMP/?format=SDMX-CSV&compressed=...
[Read more...]

Analyzing data from COVID19 R package

May 26, 2020 | R | TypeThePipe

Introduction The idea behind this post was to play and discover some of the info contained in the COVID19 R package which collects data across several governmental sources.This package is being developed by the Guidotti and Ardia from COVID19 Data Hub. Later, I will add to the analysis the ...
[Read more...]

Calculating ratios with Tidyverse

May 12, 2020 | R | TypeThePipe

Calculating percentages is a fairly common operation, right? However, doing it without leaving the pipeflow always force me to do some bizarre piping such as double grouping and summarise. I am using again the nuclear accidents dataset, and trying to calculate the percentage of accidents that happened in Europe each ... [Read more...]

Preserving zero-length groups

May 8, 2020 | R | TypeThePipe

This week I learned about another neat trick with tidyverse functions: the argument .drop from the group_by function. To showcase this functionality I made up a simple example with this dataset consisting of nuclear accidents data. original_data % mdy() %__% year(), In_Europe = if_else(Region %in% c("EE", "WE"), ...
[Read more...]

Drop columns based on NAs percentage in R

March 22, 2020 | R | TypeThePipe

Are you developing an automated exploration tool? Here we propose some alternatives to drop columns with high percentage of NAs. In this previous tip we talk about BaseR vs Tidy & Purrr counting NAs performance. Not leaving the pipeflow. How much does it cost?;) It depends on the NA distribution between ...
[Read more...]

Tidylog. Logging your pipelines

January 20, 2020 | R | TypeThePipe

Some time ago I made one of the best discoveries I have ever made in the Tidyverse: a tool called tidylog. This package is built on top of dplyr and tidyr and provides us with feedback on the results of the operations. Actually, this is a feature that already appeared ... [Read more...]

Tidylog

January 20, 2020 | R | TypeThePipe

Some time ago I made one of the best discoveries I have ever made in the Tidyverse: a tool called tidylog. This package is built on top of dplyr and tidyr and provides us with feedback on the results of the operations. Actually, this is a feature that already appeared ... [Read more...]

Using summarise_at(). Weighted mean Tidyverse approach

January 15, 2020 | R | TypeThePipe

Supose you are analysing survey data. You are asked to get the mean in a representative way, weighting your individuals depending on the number of members of their segment. library(tidyverse) survey_data % group_by(region1, region2, gender) %__% mutate(weight = 1/n()) %__% ungroup() %__% summarise_at(vars(contains("q")), funs(weighted_mean = ... [Read more...]

Skills chart using Gplot2 with R

January 6, 2020 | R | TypeThePipe

In this TypeThePipe tip we are bringing you a skills plot template using R and ggplot2. Maybe its a good idea to evolve this plot and add an unique skill plot to your CV. And it’s only a few lines of R code! You can see the code below :) ...
[Read more...]

Reordering bars in GGanimate visualization

December 15, 2019 | R | TypeThePipe

Last week several gganimate visualizations came to my feed. Some R users were wondering about reordering gganimate and ggplot2 bars as long as them are evolving (over animation time). Then, we came up with this R viz where several bars are not only evolving and reordering over time but leaving ... [Read more...]

Conditional Pipes

November 1, 2019 | R | TypeThePipe

How could we apply certain functions conditionally without leaving the pipeflow? This way: df %__% { if(apply_filter == TRUE) filter(., condition) else . } %__% ... [Read more...]

Counting NAs by column in R

October 1, 2019 | R | TypeThePipe

Are you starting your data exploration? Do you want to have an easy overview of your variable NA percentage? We create a function to benchmark different ways of achieving it: library(microbenchmark) library(tidyverse) benchmark_count_na_by_column % summary(), # Numeric output colSums(is.na(dataset)), sapply(dataset, function(x) ... [Read more...]

Never miss an update!
Subscribe to R-bloggers to receive
e-mails with the latest R posts.
(You will not see this message again.)

Click here to close (This popup will not appear again)