2021

ShinyProxy 2.6.0

November 8, 2021 | Open Analytics

ShinyProxy 2.6.0 
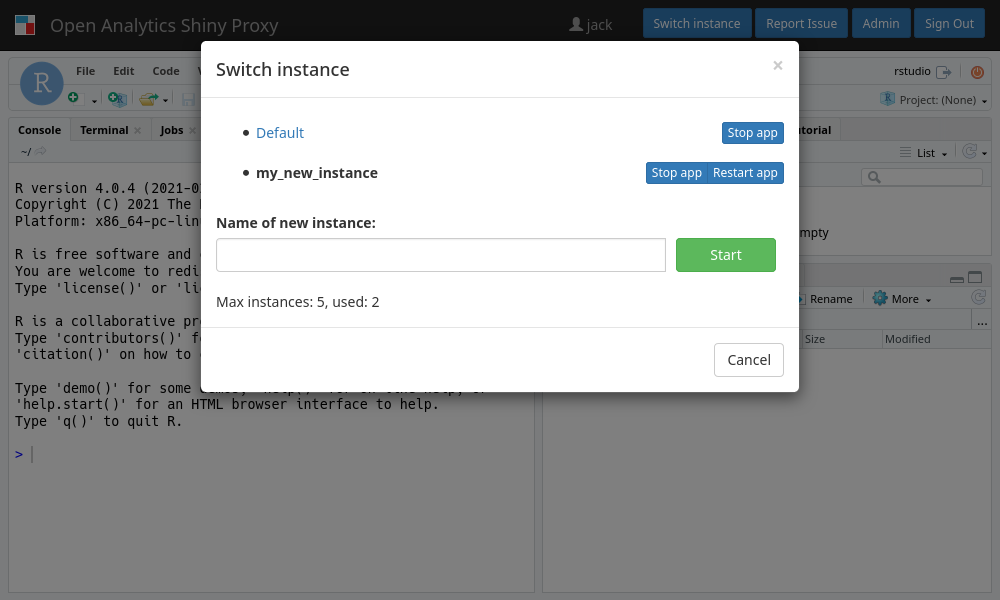
Today we release version 2.6.0 of ShinyProxy which includes over forty improvements. ShinyProxy is a novel, open source platform to deploy Shiny apps for the enterprise or larger organizations. Nevertheless, ShinyProxy is also an exce...
[Read more...]

Granger Causality Test in R (with Example)

November 8, 2021 | finnstats

Granger-Causality Test in R, The Granger Causality test is used to examine if one time series may be used to forecast another. Null Hypothesis (H0): Time series X does not cause time series Y... The post Granger Causality Test in R (with Example) appeared first on finnstats. [Read more...]

Should I Move to a Database?

November 7, 2021 | Roel M. Hogervorst

Long ago at a real-life meetup (remember those?), I received a t-shirt which said: “biggeR than R”. I think it was by microsoft, who develop a special version of R with automatic parallel work. Anyways, I was thinking about bigness (is that a word? it is now!) of your data. ... [Read more...]

How fast is M1?

November 7, 2021 | R on Harshvardhan

I upgraded my laptop to MacBook Air (2020) with the infamous M1 processor a few days ago. I went after the most powerful machine in the category, one with 16 gigabytes of RAM and one terabyte of storage — I didn’t want to regret my choices ...
[Read more...]

A Structural Model of the World Happiness Report

November 7, 2021 | Blogs on Adejumo R.S

“If you can’t explain it simply, you don’t understand it well enough.” — Albert Einstein Introduction Structural equation modelling is a statistical technique used mostly in behavioral and cognitive sciences to see how some selected factors affect a latent variable. A latent variable is a variable that can’t ...
[Read more...]

{binance} Spot Trading: Liquidity

November 7, 2021 | R - datawookie

In previous posts we looked at creating market orders and limit orders with {binance}. We saw a couple of successful trades. However, sometimes trades are not successful and the orders are not filled. Let’s try to understand why. The setup will be the same as the previous posts and ...
[Read more...]

Markov Transition (Animated) Plots

November 6, 2021 | R on Data & The World

This is a quick post intended for animating how the transition matrix of a Markov chain changes between larger time steps, as well as showing the probability of the chain being in any specified state over time. This post uses the tidyverse, along with ... [Read more...]

Bond Forward Pricing using R code

November 6, 2021 | sang-heon lee

This post presents a R code for pricing a bond forward. It is well known that insurance companies use it as the instrument of a duration management with lower cost. Here, a pricing formula and its implementation are provided with delta sensitivity u...
[Read more...]

String Manipulation in R

November 6, 2021 | finnstats »

String Manipulation in R, In this article, we’ll show you how to manipulate strings in the R programming language using many methods. To begin, we’ll read text from a file into the computer to demonstrate the string operations. data&...
[Read more...]

String Manipulation in R

November 6, 2021 | finnstats

String Manipulation in R, In this article, we’ll show you how to manipulate strings in the R programming language using many methods. To begin, we’ll read text from a file into the computer to... The post String Manipulation in R appeared first on finnstats. [Read more...]

Benchmarking Rcpp code with RcppClock

November 5, 2021 | Rcpp Gallery

Rcpp is all about the need for speed. However, Rcpp code is not magically fast, but is the result of careful coding and profiling. RcppClock makes it easy to profile C++ code from R: On the C++ side, RcppClock wraps std::chrono::high_resolution_clo...
[Read more...]

How to Plot Observed and Predicted values in R

November 5, 2021 | finnstats

Plot Observed and Predicted values in R, In order to visualize the discrepancies between the predicted and actual values, you may want to plot the predicted values of a regression model in R. This... The post How to Plot Observed and Predicted values in R appeared first on finnstats.
[Read more...]
1 13 14 15 16 17 117

Never miss an update!
Subscribe to R-bloggers to receive
e-mails with the latest R posts.
(You will not see this message again.)

Click here to close (This popup will not appear again)