ESGtoolkit, a tool for Monte Carlo simulation (v0.2.0)
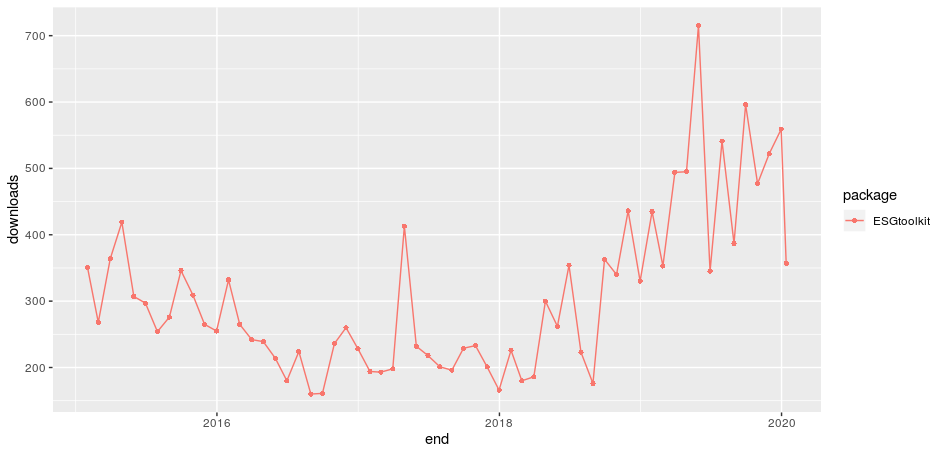
I’m still receiving questions about ESGtoolkit – a tool that I developped in 2014 for stochastic simulation – from time to time, even if it’s not really my current focus. As I also noticed recently, ESGtoolkit is downloaded a few times each month: