2019

R comes to oil + gas

September 10, 2019 | modern.data

Tools capable of producing rich analytic reports and data visualizations are a valuable resource for decision makers in any field. Dash is an open-sourced based framework for building dynamic web applications that seamlessly integrates interactive graphics and tabular data summaries, serving as a catalyst for data-driven decision-making. Several features of ...
[Read more...]

Hadley is a smash hit at LondonR

September 10, 2019 | Matt Aldridge

We were thrilled to host Hadley Wickham who delivered, as ever, a funny and engaging talk to a packed house at LondonR in August. In fact, to give you an idea of how much anticipated this event was, tickets to see Hadley sold out in under two hours! It’s ... [Read more...]

Extracting Sydney transport data from Twitter

September 10, 2019 | nsaunders

The @sydstats Twitter account uses this code base, and data from the Transport for NSW Open Data API to publish insights into delays on the Sydney Trains network. Each tweet takes one of two forms and is consistently formatted, making it easy to parse and extract information. Here are a ...
[Read more...]

auditor: a guided tour through residuals

September 9, 2019 | R on FeelML

Machine learning is a hot topic nowadays, thus there is no need to convince anyone about its usefulness. ML models are being successfully applied in biology, medicine, finance, and so on. Thanks to modern software, it is easy to train even a complex model that fits the training data and ...
[Read more...]

R Community Explorer – R User Groups

September 9, 2019 | josephrickert

By Ben Ubah, Claudia Vitolo and Rick Pack We recently announced an R-Ladies focused open-source dynamic dashboard built using R and Javascript. That work has now been extended to encompass... The post R Community Explorer – R User Groups appeared first on R Consortium.
[Read more...]

New R Consortium Blog Guidelines

September 9, 2019 | R Consortium

The R Consortium is posting new blog guidelines to help facilitate posts from members, ISC grants recipients and the community at large. Please review and send in your ideas! R... The post New R Consortium Blog Guidelines appeared first on R Consortium. [Read more...]

Catch us at these conferences!

September 9, 2019 | Theo Roe

At Jumping Rivers we're always to want to branch into the data science community, and so this year we're going to quite a few conferences in the autumn. You can catch us at: GSS (Government Statistical Service) Conference - Edinburgh From the 1-2 October, our very own Esther Gillespie (CEO) ... [Read more...]

R Neural Network

September 9, 2019 | Ian Johnson

In the previous four posts I have used multiple linear regression, decision trees, random forest, gradient boosting, and support vector machine to predict MPG for 2019 vehicles.   It was determined that svm produced the best model.  In this post I am going to use the neuralnet package to fit a neural ...
[Read more...]

pins: Pin, Discover and Share Resources

September 8, 2019 | Javier Luraschi

Today we are excited to announce the pins package is available on CRAN! pins allows you to pin, discover and share remote resources, locally or in remote storage. If you find yourself using download.file() or asking others to download files before running your R code, use pin() to achieve ...
[Read more...]

Was Trump confused by rainbow color map?

September 8, 2019 | Achim Zeileis

In the controversy over Hurricane Dorian, US President Donald Trump repeatedly claimed that early forecasts showed a high probability of Alabama being hit. We demonstrate that a potentially confusing rainbow color map in the official weather ...
[Read more...]

Was Trump confused by rainbow color map?

September 8, 2019 | Achim Zeileis

In the controversy over Hurricane Dorian, US President Donald Trump repeatedly claimed that early forecasts showed a high probability of Alabama being hit. We demonstrate that a potentially confusing rainbow color map in the official weather ... [Read more...]

Was Trump confused by rainbow color map?

September 8, 2019 | Achim Zeileis

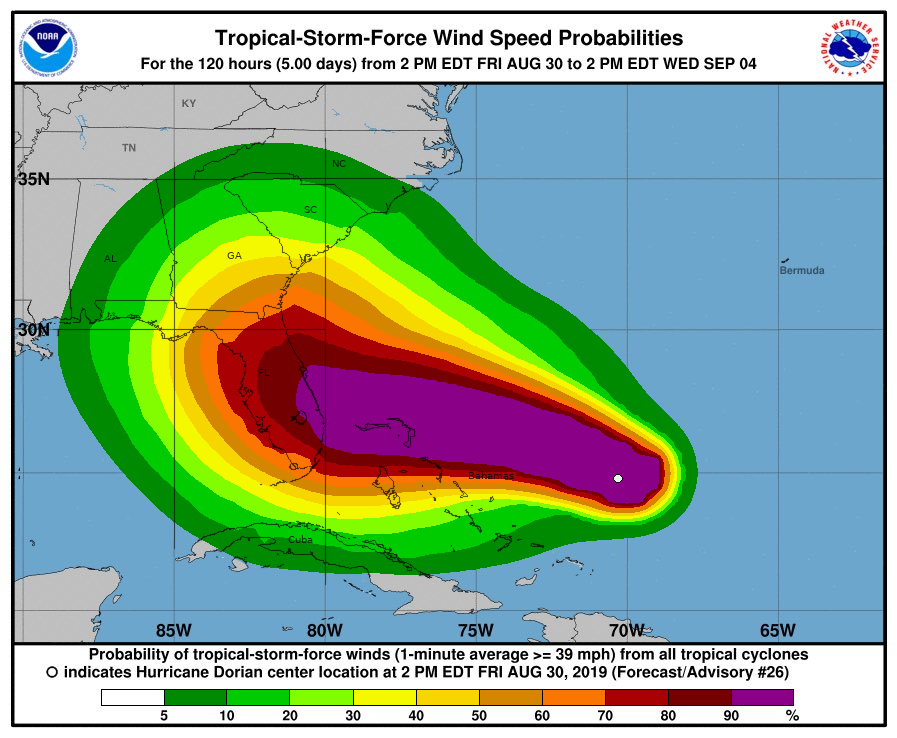
In the controversy over Hurricane Dorian, US President Donald Trump repeatedly claimed that early forecasts showed a high probability of Alabama being hit. We demonstrate that a potentially confusing rainbow color map in the official weather forecasts may have attributed to Trump overestimating the risk. Hurricane Dorian and the Alabama ...
[Read more...]
1 41 42 43 44 45 155

Never miss an update!
Subscribe to R-bloggers to receive
e-mails with the latest R posts.
(You will not see this message again.)

Click here to close (This popup will not appear again)