September 2019
Chebychev’s Theorem gives bounds on how spread out a probability distribution can be from the mean, in terms of the standard deviation. More precisely, if \(X\) is a random variable with mean \(\mu\) and standard deviation \(\sigma\), then \[
P(|X - ... [Read more...]
Fitting ‘complex’ mixed models with ‘nlme’: Example #2
A repeated split-plot experiment with heteroscedastic errors
Let’s imagine a field experiment, where different genotypes of khorasan wheat are to be compared under different nitrogen (N) fertilisation systems. Genotypes require bigger plots, with respect to fertilisation treatments and, therefore, the most convenient choice would be to lay-out the experiment ... [Read more...]
Social Network Visualization with R
In this month’s we are going to look at data analysis and visualization of social networks using R programming. Friendster Networks Mapping Friendster was a yesteryear social media network, something akin to Facebook. I’ve never used it but it is one of those easily available datasets where you ...

WVPlots 1.1.2 on CRAN
I have put a new release of the WVPlots package up on CRAN. This release adds palette and/or color controls to most of the plotting functions in the package. WVPlots was originally a catch-all package of ggplot2 visualizations that we at Win-Vector tended to use repeatedly, and wanted to ...

Survival analysis with strata, clusters, frailties and competing risks in in Finalfit
Background In healthcare, we deal with a lot of binary outcomes. Death yes/no, disease recurrence yes/no, for instance. These outcomes are often easily analysed using binary logistic regression via finalfit(). When the time taken for the outcome to occur is important, we need a different approach. For instance, ...

A DevOps Process for Deploying R to Production
I've been at the EARL Conference in London this week, and as always it's been inspiring to see so many examples of R being used in production at companies like Sainsbury's, BMW, Austria Post, PartnerRe, Royal Free Hospital, the BBC, the Financial Times, and many others. My own talk, A ... [Read more...]
Use more of your data with matrix factorisation
Previously I posted on how to apply gradient descent on linear regression as an example. With that as background it’s […]
The post Use more of your data with matrix factorisation appeared first on Daniel Oehm | Gradient Descending.
[Read more...]
Gold-Mining Week 2 (2019)
Welcome to the 2019 Fantasy Football Season! Week 2 Gold Mining and Fantasy Football Projection Roundup now available.
The post Gold-Mining Week 2 (2019) appeared first on Fantasy Football Analytics.
[Read more...]
Call for Help: Lead R/Shiny Developer
Dear Fantasy Football Analytics Community, In 2013, we at Fantasy Football Analytics released web apps to help people make better decisions in fantasy football based on the wisdom of the[...]
The post Call for Help: Lead R/Shiny Developer appeared first on Fantasy Football Analytics.
[Read more...]
R/Medicine 2019 Workshops
R/Medicine 2019 kicked off on Thursday with two outstanding workshops. It was difficult to choose between the two, but fortunately both presenters developed rich sets of materials that are available online.
Alison Hill delivered R Markdown for Medicine with an elegant HTML exposition masterfully created to cultivate beginners while still ...

Running R Projects in MyBinder – Dockerfile Creation With Holepunch
For those who don’t know it, MyBinder is a reproducible research automation tool that will take the contents of a Github repository, build a Docker container based on requirements files found inside the repo, and then present the user with a temporary, running container that can serve a Jupyter ...

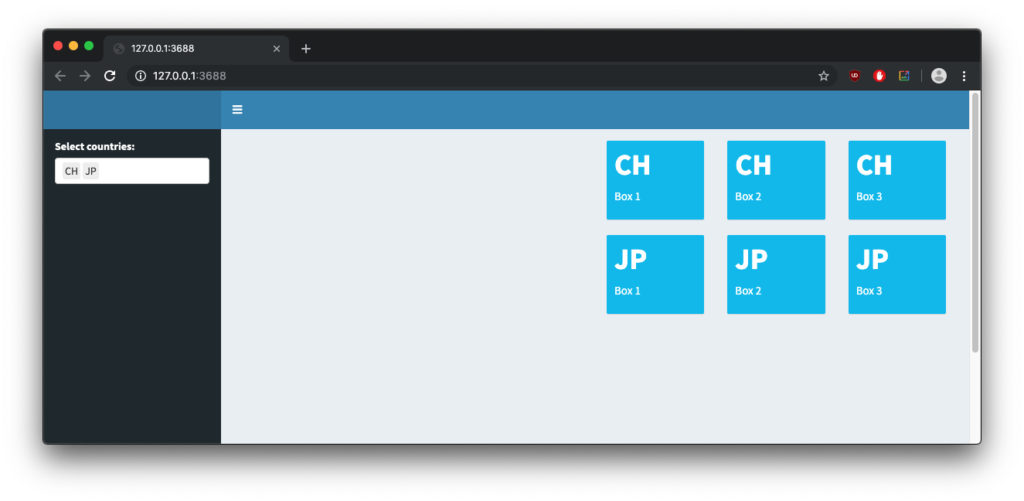
Dynamic UI Elements in Shiny
Shiny enables its users to quickly create a fixed UI with code. Although simple, this can prove to be quite limiting. Applying the principles of reactivity to the UI part of a ShinyApp is a natural progression from reactive coding as we know it already from Shiny's server side. This ...

Finding the Modal School District
My good friend Ryan Estrellado recommended an NPR Planet Money podcast episode on the “Modal American.” Working with Ben Casselman, Planet Money explored the most ‘typical’ American. It was a fantastic, engaging episode about a common statistical technique that I’ve never seen applied in this way before. They ran ...

investmentsim – an R Package for Simulating Investment Portfolios
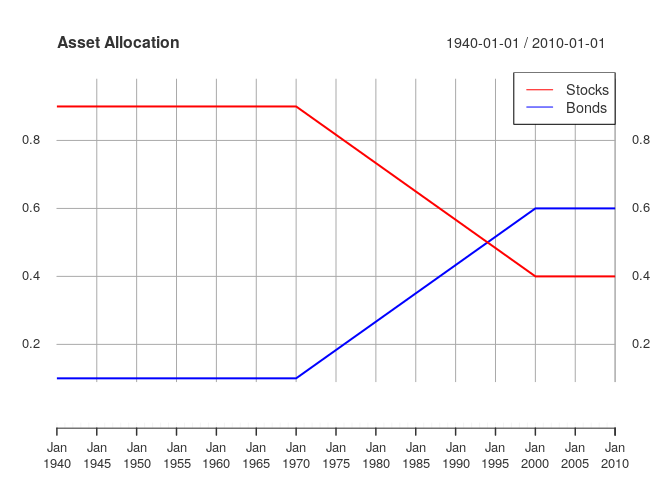
I wrote a little package recently for a project I’ve been working on. I’ve mostly been using it to help out with Monte Carlo simulations for personal finance planning. It’s a little rough at the moment, but for the adventurous it’s on Github here: investmentsim. And ...

R comes to oil + gas
Tools capable of producing rich analytic reports and data visualizations are a valuable resource for decision makers in any field. Dash is an open-sourced based framework for building dynamic web applications that seamlessly integrates interactive graphics and tabular data summaries, serving as a catalyst for data-driven decision-making. Several features of ...
Looking Up R / CRAN Package Maintainers With an ac.uk Affiliation
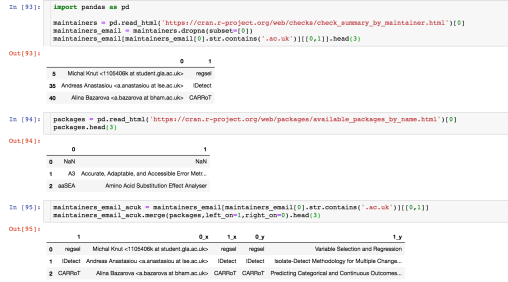
Trying to find an examiner for a particular PhD thesis relating to a rather interesting datastructure for wrangling messy datatables, I wondered whether we might find a likely suspect amongst the R package maintainer community. We can get a list of R package maintainers here and a list of package ...

Hadley is a smash hit at LondonR
We were thrilled to host Hadley Wickham who delivered, as ever, a funny and engaging talk to a packed house at LondonR in August. In fact, to give you an idea of how much anticipated this event was, tickets to see Hadley sold out in under two hours! It’s ... [Read more...]
Extracting Sydney transport data from Twitter
The @sydstats Twitter account uses this code base, and data from the Transport for NSW Open Data API to publish insights into delays on the Sydney Trains network. Each tweet takes one of two forms and is consistently formatted, making it easy to parse and extract information. Here are a ...

Is the pain worth it?: Can Rcpp speed up Passing Bablok Regression?
Background R dogma is that for loops are bad because they are slow but this is not the case in C++. I had never programmed a line of C++ as of last week but my beloved firstborn started university last week and is enrolled in a C++ intro course, so ...

Copyright © 2022 | MH Corporate basic by MH Themes