June 2019

Le Monde puzzle [#1104]

June 17, 2019 | xi'an

A palindromic Le Monde mathematical puzzle: In a monetary system where all palindromic amounts between 1 and 10⁸ have a coin, find the numbers less than 10³ that cannot be paid with less than three coins. Find if 20,191,104 can be paid with two coins. Similarly, find if 11,042,019 can be paid with two or […]
[Read more...]

Digital Water Utility Competencies: R for Water Professionals

June 17, 2019 | Peter Prevos

The digital water utility is a fashionable catchphrase in the water industry. Managing reliable water services requires not only a sufficient volume of water but also significant amounts of data. Water professionals continuously measure the flow and quality of the water and how customers perceive their service. Water professionals analyse ...
[Read more...]

On my way to Manizales (Colombia)

June 16, 2019 | arthur charpentier

Next week, I will be in Manizales, Colombia, for the Third International Congress on Actuarial Science and Quantitative Finance. I will be giving a lecture on Wednesday with Jed Fress and Emilianos Valdez. I will give my course on Algorithms for Predictive Modeling on Thursday morning (after Jed and Emil’...
[Read more...]

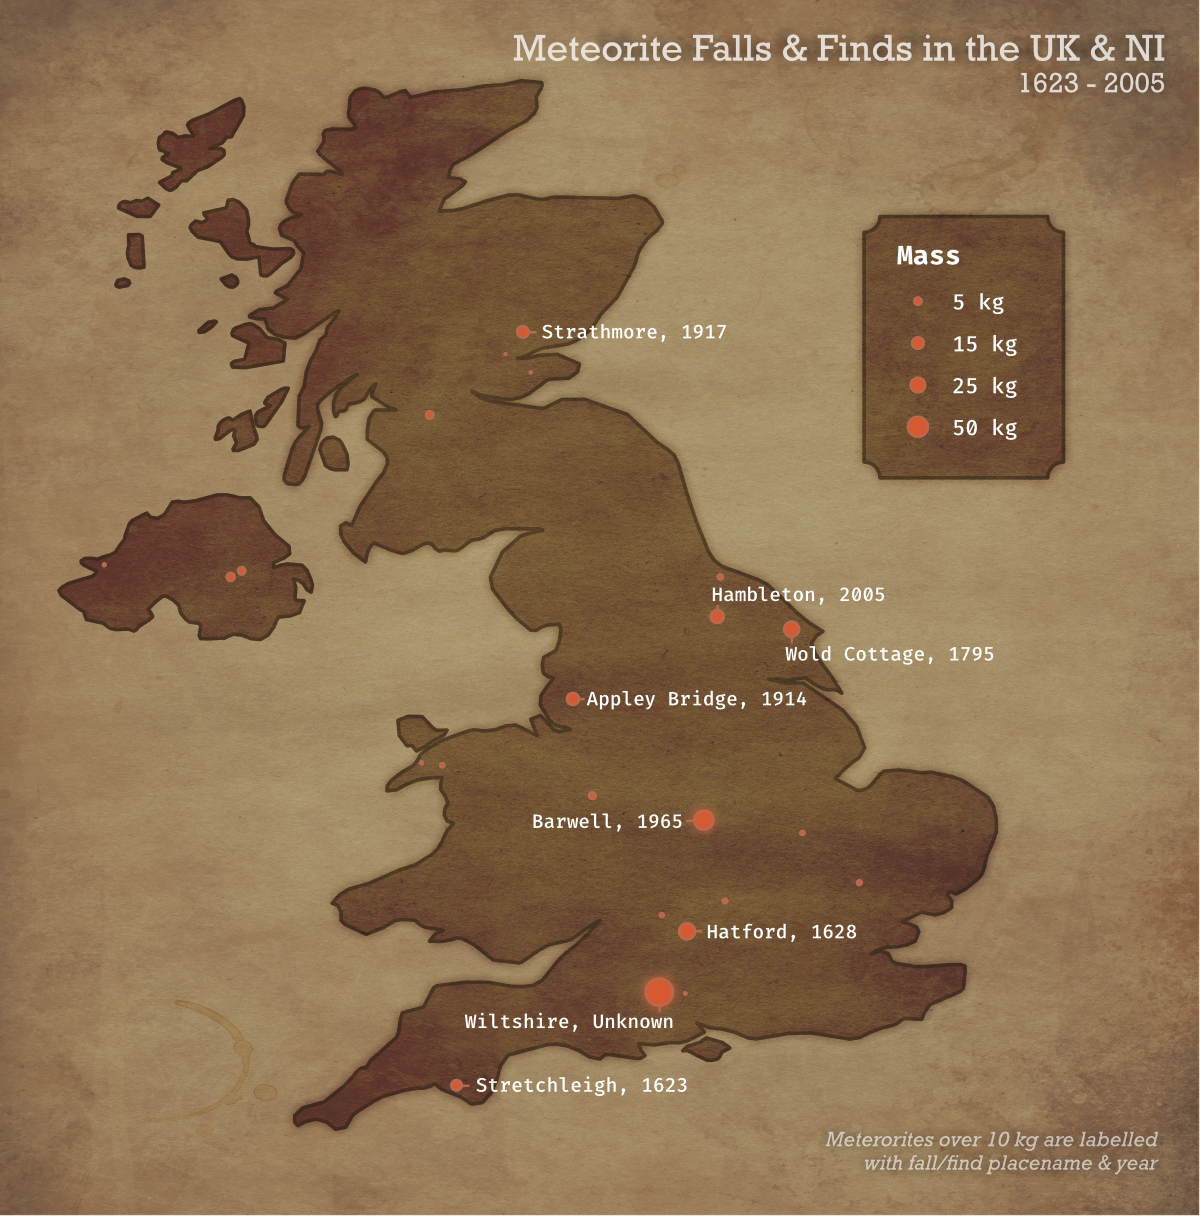
Meteorite Falls and Finds in the UK

June 16, 2019 | » R

(Tidy Tuesday is a project to supply weekly data sets for R users to practice their coding skills on. You can find full details here.) The Tidy Tuesday dataset for this week, compiling meteorite strikes across the world, grabbed my interest so I decid...
[Read more...]

Forecasting tools in development

June 16, 2019 | - r

As I’ve been writing up a progress report for my NIGMS R35 MIRA award, I’ve been reminded at how much of the work that we’ve been doing is focused on forecasting infrastructure. A common theme in the Reich Lab is making operational forecasts of i... [Read more...]

modelDown is now on CRAN!

June 16, 2019 | smarterpoland

The modelDown package turns classification or regression models into HTML static websites. With one command you can convert one or more models into a website with visual and tabular model summaries. Summaries like model performance, feature importance, single feature response profiles and basic model audits. The modelDown uses DALEX explainers. ... [Read more...]

Introducing the {ethercalc} package

June 15, 2019 | hrbrmstr

I mentioned EtherCalc in a previous post and managed to scrounge some time to put together a fledgling {ethercalc} package (it’s also on GitLab, SourceHut, Bitbucket and GitUgh, just sub out the appropriate URL prefix). I’m creating a package-specific Docker image (there are a couple out there but ...
[Read more...]

Comrades Marathon (2019) Start Delay

June 14, 2019 | R | datawookie

How long does it take to cross the start line at the Comrades Marathon? If you’re lucky enough to be starting in one of the batches which is close to the front then this might be a matter of seconds to a couple of minutes. But if you’re ...
[Read more...]

Comrades Marathon (2019) Start Delay

June 14, 2019 | R on datawookie

How long does it take to cross the start line at the Comrades Marathon? If you’re lucky enough to be starting in one of the batches which is close to the front then this might be a matter of seconds to a couple of minutes. But if you’re ...
[Read more...]

Comrades Marathon: Start Delay

June 14, 2019 | R on datawookie

How long does it take to cross the start line at the Comrades Marathon? If you’re lucky enough to be starting in one of the batches which is close to the front then this might be a matter of seconds to a couple of minutes. But if you’re ...
[Read more...]

Fun with R and the Noops

June 14, 2019 | David Smith

Earlier this week, Github introduced Noops, a collection of simple black-box machines with API endpoints, with the goal of challenging developers of all skill levels to solve problems with them. Five "Noops" machines have been released so far along with challenges suitable for beginner programmers, with 15 further machines (and some ...
[Read more...]

Periodogram with R

June 13, 2019 | Chris Carbone

Periodogram with R The power spectral density (PSD) is a function that describes the distribution of power over the frequency components composing our data set. If we knew the process that generated the data, we could just calculate the PSD; we would not have to estimate it. Unfortunately, in practice ...
[Read more...]

#rstats adventures in the land of @rstudio shiny (apps)

June 13, 2019 | lortie

PreambleColleagues and I had some sweet telemetry data, we did some simple models (& some relatively more complex ones too), we drew maps, and we wrote a paper. However, I thought it would be great to also provide stakeholders with the capacity to engage with the models, data, and maps. I ... [Read more...]
1 5 6 7 8 9 13

Never miss an update!
Subscribe to R-bloggers to receive
e-mails with the latest R posts.
(You will not see this message again.)

Click here to close (This popup will not appear again)