
Articles by Chris Carbone
Autoregressive Moving Average Models and Power Spectral Densities
1 Introduction
The simplest way to estimate a power spectral density (PSD) is to use a periodogram, defined as
periodogram
Get Your Data On 2023-07-16 21:19:00
Autoregressive Estimation and the AIC
Autoregressive Estimation and the AIC
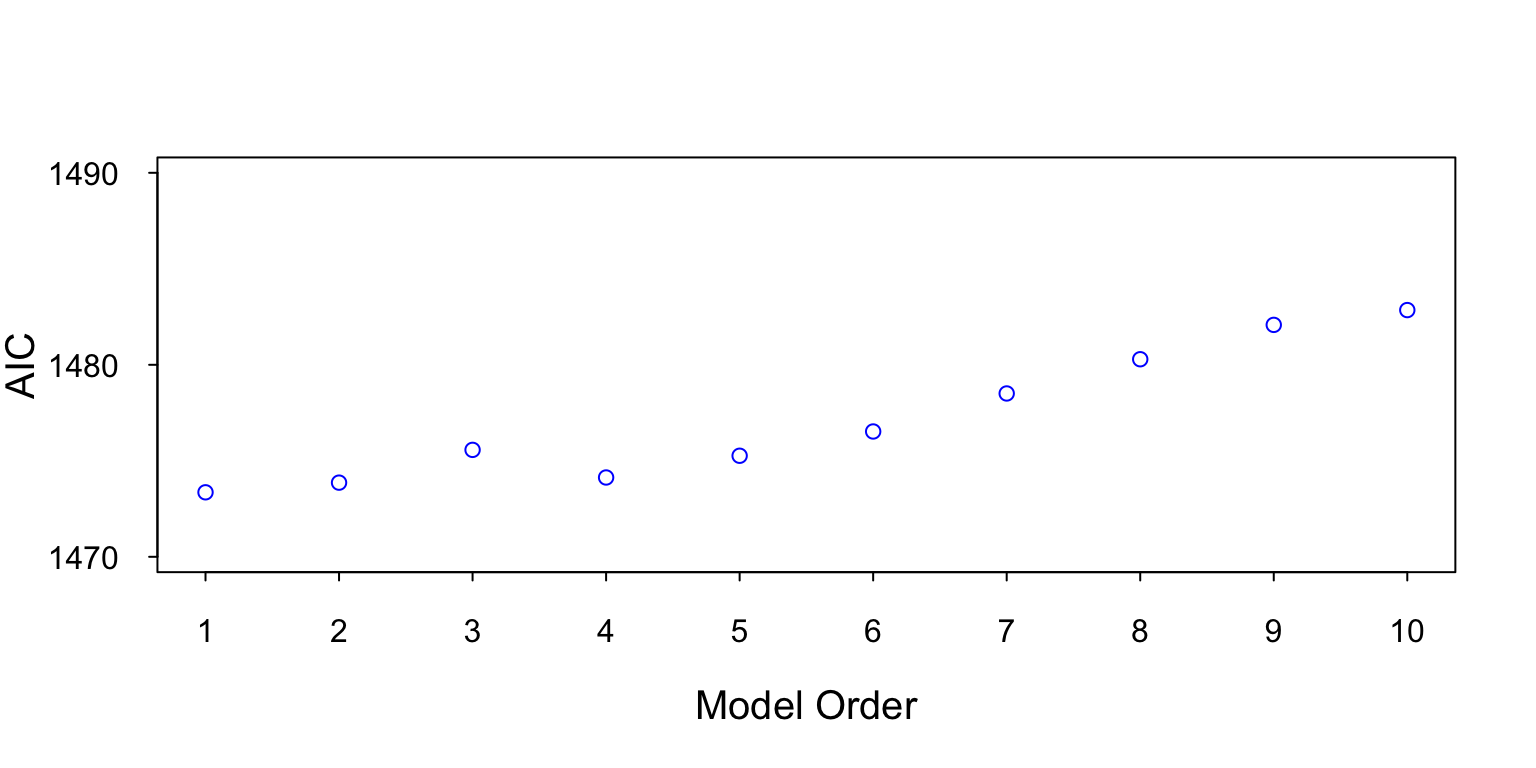
1 Model Order Selection
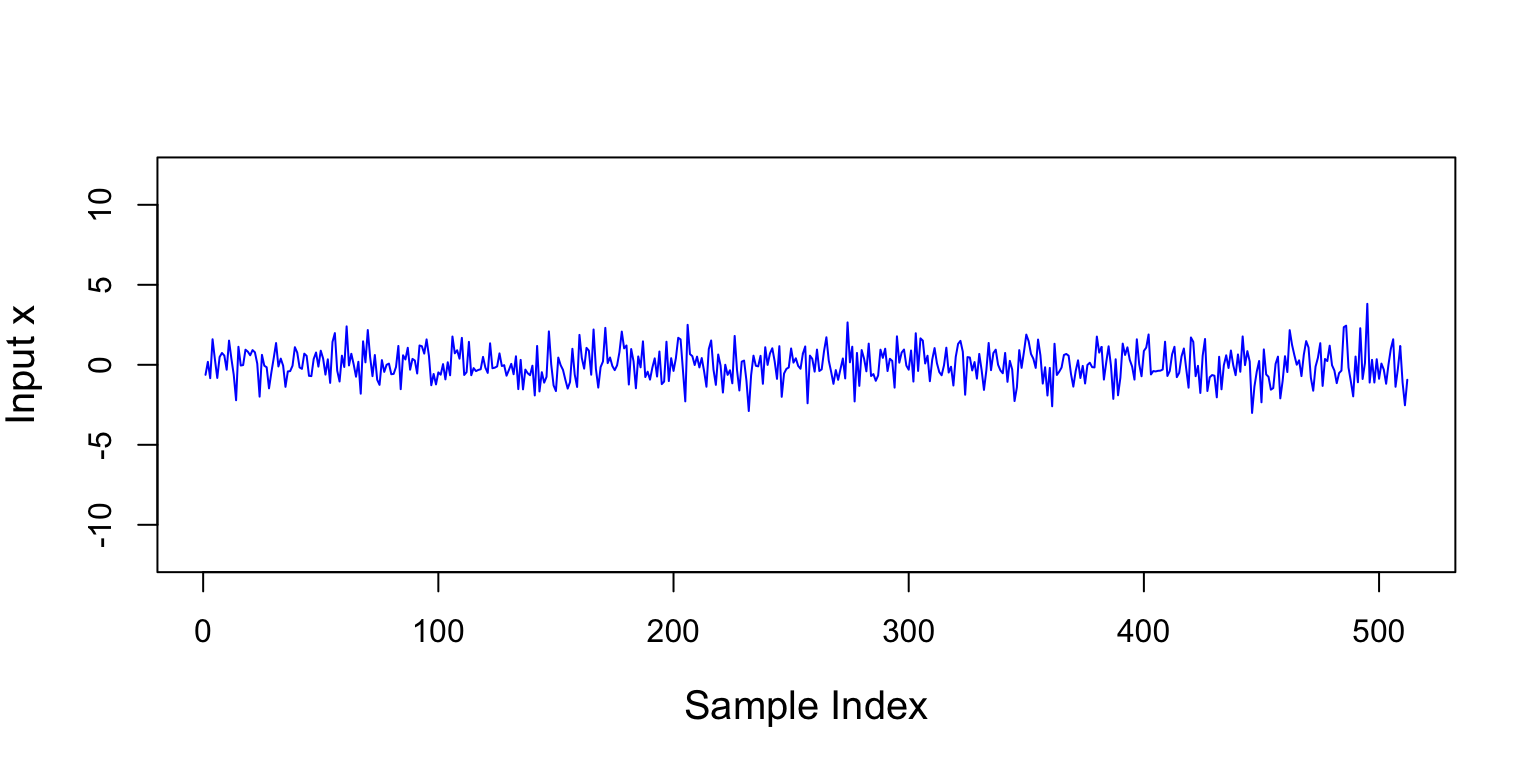
This section provides a brief introduction to autoregressive (AR) model order estimation. An AR model of order p (AR[p]) can model up to p peaks in a PSD. So, if we wanted to estimate a PSD ...
The Periodogram or Something Else?
The periodogram is the simplest and most common spectral estimator and, in R is implemented as findPer
Filtering Complex Data With gsignal
Filtering Complex Data with gsignal IntroductionThe gsignal packageis a new signal processing library ported from Octave. If you use Matlab or Octave, gsignal contains many of the signal processing functions you would expect to find. In this p...

Filtering Complex Data with R
Filtering
Base R has a function filter that can perform moving average (MA) or filters (AR). But it cannot do both at the same time; it cannot do an autoregresive ARMA filter. It also only works on real data. The filter function in the signal package can perform ARMA filters, ...

Filtering Complex Data with R
FilteringBase R has a function filter that can perform moving average (MA) or filters (AR). But it cannot do both at the same time; it cannot do an autoregresive ARMA filter. It also only works on real data. The filter function in the signal package can perform ARMA filters, but ...
Dungeons and Dragons: Advantage
D20 and Random Events In the game Dungeons and Dragons, the success or failure of an event is determined by rolling a 20 sided die (D20): higher is better. If you need to roll 11 or higher you have a 50% chance of success. If another event requires 10 or better you now have ...
Complex Normal Samples In R
Normal Samples
If we want 10 samples from a Gaussian or normal random process with variance 4 can use rnorm(10,sd=2). Remember the standard deviation (sd) is the square root of the variance.
set.seed(2)x [Read more...]
Book Review: Introductory Time Series with R
I'm a big fan of R and time series analysis, so I was excited to read the book "Introductory Time Series with R. I've been using the book for about 9 years, so I thought it was about time for a review! In this review, I'm going to cover the following ... [Read more...]
Book Review: Advanced R
When I first started using R, my code looked just like MATLAB code. I read an intro to R programming, did some data analysis using R, and I was using the arrow assignment operator! But otherwise, my R code looked very much like MATLAB. Then I read Advanced R by ... [Read more...]
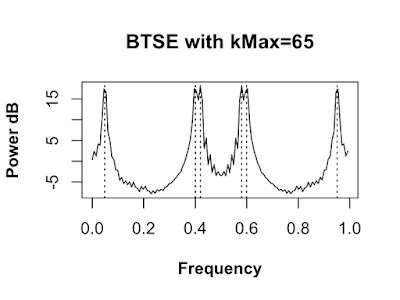
Blackman-Tukey Spectral Estimator in R
Blackman-Tukey Spectral Estimator in R!
There are two definitions of the power spectral density (PSD). Both definitions are mathematically nearly identical and define a function that describes the distribution of power over the frequency components in our data set. The periodogram PSD estimator is based on the first definition of ...
Periodogram with R
Periodogram with R
The power spectral density (PSD) is a function that describes the distribution of power over the frequency components composing our data set. If we knew the process that generated the data, we could just calculate the PSD; we would not have to estimate it. Unfortunately, in practice ...

Copyright © 2025 | MH Corporate basic by MH Themes