March 2019

A Quick and Tidy Look at the 2018 GSS

March 22, 2019 | R on kieranhealy.org

The data from the 2018 wave of the General Social Survey was released during the week, leading to a flurry of graphs showing various trends. The GSS is one of the most important sources of information on various aspects of U.S. society. One of the best things about it is ...
[Read more...]

Human Face Detection with R

March 22, 2019 | Super User

Doing human face detection with computer vision is probably something you do once unless you work for police departments, you work in the surveillance industry or for the Chinese government. In order to reduce the time you lose on that small exercise, bnosac created a small R package (source code ... [Read more...]

How to Choose the Best Open Source Software

March 21, 2019 | Matt.0

Photo by Pankaj Patel on UnsplashAfter reading the O’Reilly book “Foundations for Architecting Data Solutions”, by Ted Malaska and Jonathan Seidman, I reflected on how I chose software/tools/solutions in the past and how I should choose them going forward. As a bioinformatician you need to be able ...
[Read more...]

Upcoming talks in spring 2019

March 21, 2019 | Dr. Shirin Glander

This spring, I’ll be giving talks at a couple of Meetups and conferences: March, 26th: At the data lounge Bremen, I’ll be talking about Explainable Machine Learning April, 11th: At the Data Science Meetup Bielefeld, I’ll be talking about Bu...
[Read more...]

lconnect connectivity metrics

March 21, 2019 | Bruno Silva

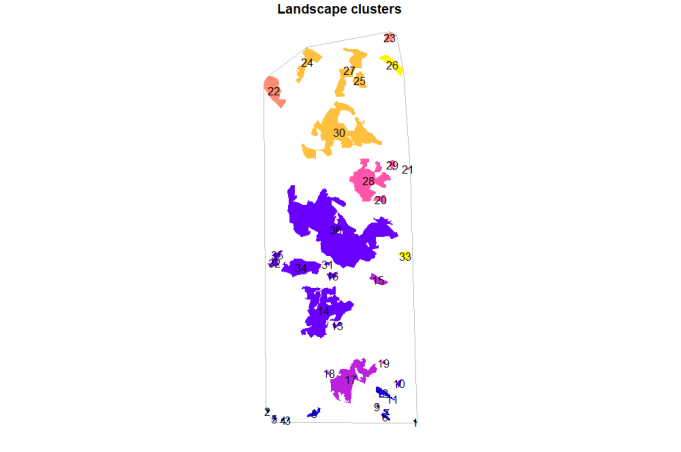
In our package lconnect we use the Integral Index of connectivity to obtain patch importance, but several other metrics are currently available. A description of each of this metrics can be found below. For more information about each metric please see the references provided. At the end of the post ... [Read more...]

Integrating Qlik Sense and R

March 21, 2019 | R on datawookie

Components Qlik Sense is a tool for exploratory data analysis and visualisation. It’s powerful and versatile. It’s can, however, be significantly enhanced by interfacing with R. Qlik Sense does not currently integrate directly with R. However, it’s not too tricky to get the two systems talking to ...
[Read more...]

Using Readability Formulas to Assess Linguistic Complexity of TED Talks using koRpus

March 20, 2019 | R on Residuals for Breakfast

Background Readability Formulas The Data Set Setup Packages Reading in the data Audience reactions Calculating readability scores Cleaning Again Exploration Views per day Changes over Time Viewership Topics Audience Laughter Engagement Conclusions Background This analysis came about because the dataset was the topic of the Stockholm R User Group (SRUG) ...
[Read more...]

How to Avoid Publishing Credentials in Your Code

March 20, 2019 | R Views

Roland Stevenson is a data scientist and consultant who may be reached on Linkedin. When accessing an API or database in R, it is often necessary to provide credentials such as a login name and password. You may find yourself being prompted with something like this: When writing an R ...
[Read more...]

All Around The World: Maps and Flags in R

March 20, 2019 | quantixed

Our lab is international. People born all over the world have come to work in my group. I’m proud of this fact, especially in the current political climate. I’ve previously used the GoogleMaps API to display a heat map on our lab webpage. It shows where in the ...
[Read more...]

RSAGA 1.0.0

March 19, 2019 | Marc Becker

[view raw Rmd] RSAGA 1.0.0 has been released on CRAN. The RSAGA package provides an interface between R and the open-source geographic information system SAGA, which offers a variety of geoscientific methods to analyse spatial data. SAGA GIS is supp... [Read more...]

Best Fantasy Player of All Time

March 19, 2019 | Analysis of AFL

One of the things I have always wondered about AFL fantasy is just who is the best fantasy player of all time? Not the fan who wins the most but who is the best player. So one possible idea would be to work out the fantasy scores of players going ...
[Read more...]
1 4 5 6 7 8 16

Never miss an update!
Subscribe to R-bloggers to receive
e-mails with the latest R posts.
(You will not see this message again.)

Click here to close (This popup will not appear again)