December 2018

Bigger & Brighter

December 31, 2018 | R | Quantum Jitter

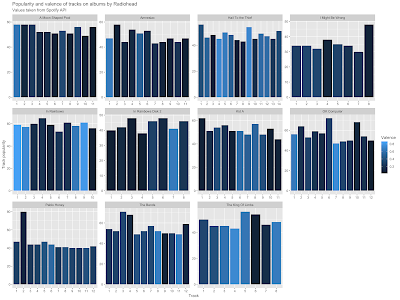
In Criminal Goings-on I initially got a sense of the data using a static facet plot. This is a great visualisation tool building on the principle of small multiples. There may come a point though where the sheer volume of small multiples make it harder to “see the wood for ...
[Read more...]

Predicting Churn Using Tree Models

December 31, 2018 | Posts on Anything Data

Today I want to predict churn using data from a hypothetical telecom company. Although it isn’t real life data, it is based on real life data. The data are spread across 19 columns — 14 continuous, 4 categorical, and the outcome variable for prediction - “churn”. The dataset is small, with 3333 rows for ... [Read more...]

Your and my 2019 R goals

December 31, 2018 | Posts on Maëlle's R blog

Here we go again, using a Twitter trend as blog fodder! Colin Fay launched an inspiring movement by sharing his R goals of 2019. My #RStats goals for 2019: 1️⃣ Becoming entirely fluent with {data.table}2️⃣ Getting at ease with {Rcpp} What are yours?#rdatatable #rcpp— Colin Fay ???? (@_ColinFay) December 29, 2018 It’s been ...
[Read more...]

Introducing RcppDynProg

December 31, 2018 | John Mount

RcppDynProg is a new Rcpp based R package that implements simple, but powerful, table-based dynamic programming. This package can be used to optimally solve the minimum cost partition into intervals problem (described below) and is useful in building piecewise estimates of functions (shown in this note). The abstract problem The ...
[Read more...]

End of 2018 Thoughts

December 30, 2018 | r-tastic

Here we are, ending yet another year and starting something new. I wanted to take a minute to dwell on 2018, what happened in my R world this year and reflexions I take from that. public speaking This year started for me with a bang - as a result of my ... [Read more...]

Tidymodels

December 28, 2018 | R on datistics

Introduction Packages CRAN availability of tidymodels packages: Unified Modelling Syntax Statistical Tests and Model Selection Resampling, Feature Engineering and Performance Metrics Modeling Data Response Variable lstat Correlations lstat vs categorical variables Preprocessing with recipe Summary Recipe Resampling with rsample Modelling with caret Wrapper Apply Wrapper Assess Performance with yardstick Parameters ...
[Read more...]

Using emojis as scatterplot points

December 27, 2018 | kjytay

Recently I wanted to learn how to use emojis as points in a scatterplot points. It seems like the emojifont package is a popular way to do it. However, I couldn’t seem to get it to work on my machine … Continue reading →
[Read more...]

My R Take on Advent of Code – Day 3

December 27, 2018 | r-tastic

Ho, ho, ho, Happy Chris.. New Year? Between eating the sea of fish (as the Polish tradition requires), assembling doll houses and designing a new kitchen, I finally managed to publish the third post on My R take on Advent of Code. To keep things short and sweet, here’s ... [Read more...]

My #Best9of2018 tweets

December 27, 2018 | Posts on Maëlle's R blog

As 2018 nears its end, it’s time for me to look back on my R/Twitter year with the same simple method as last year: let me identify and webshoot my 9 best tweets of 2018! Downloading and opening my Twitter data Like in 2017 I tweeted too much and therefore was unable ...
[Read more...]

French Mortality Poster

December 27, 2018 | R on kieranhealy.org

Based on the heatmaps I drew earlier this month, I made a poster of two centuries of data on mortality rates in France for males and females. It turned out reasonably well, I think. I will probably get it blown up to a nice large size and put it up ... [Read more...]
1 2 3 13

Never miss an update!
Subscribe to R-bloggers to receive
e-mails with the latest R posts.
(You will not see this message again.)

Click here to close (This popup will not appear again)