
October 2018

How is content created at DataCamp?
A decision was made early in DataCamp's history to outsource our instructors so we can attract the best talent and build as many high-quality courses and projects as quickly as possible. DataCamp instructors -- academics, data scientists in industry, a...

Data Science With R Course Series – Week 4
This week in the Data Science With R Course Series we’ll cover Data Preparation, where we structure the data in preparation for modeling. This week’s modules will teach you:
How to create a preprocessing pipeline with the recipes package
How ... [Read more...]
GeoJSON Version of CBC Quebec Ridings Hex Cartograms with Example Usage in R
The CBC covered the recent (as of the original post-time on this blog entry) Quebec elections and used a well-crafted hex grid map to display results: They have a great ‘splainer on why they use this type of map. Thinking that it may be useful for others, I used a ...

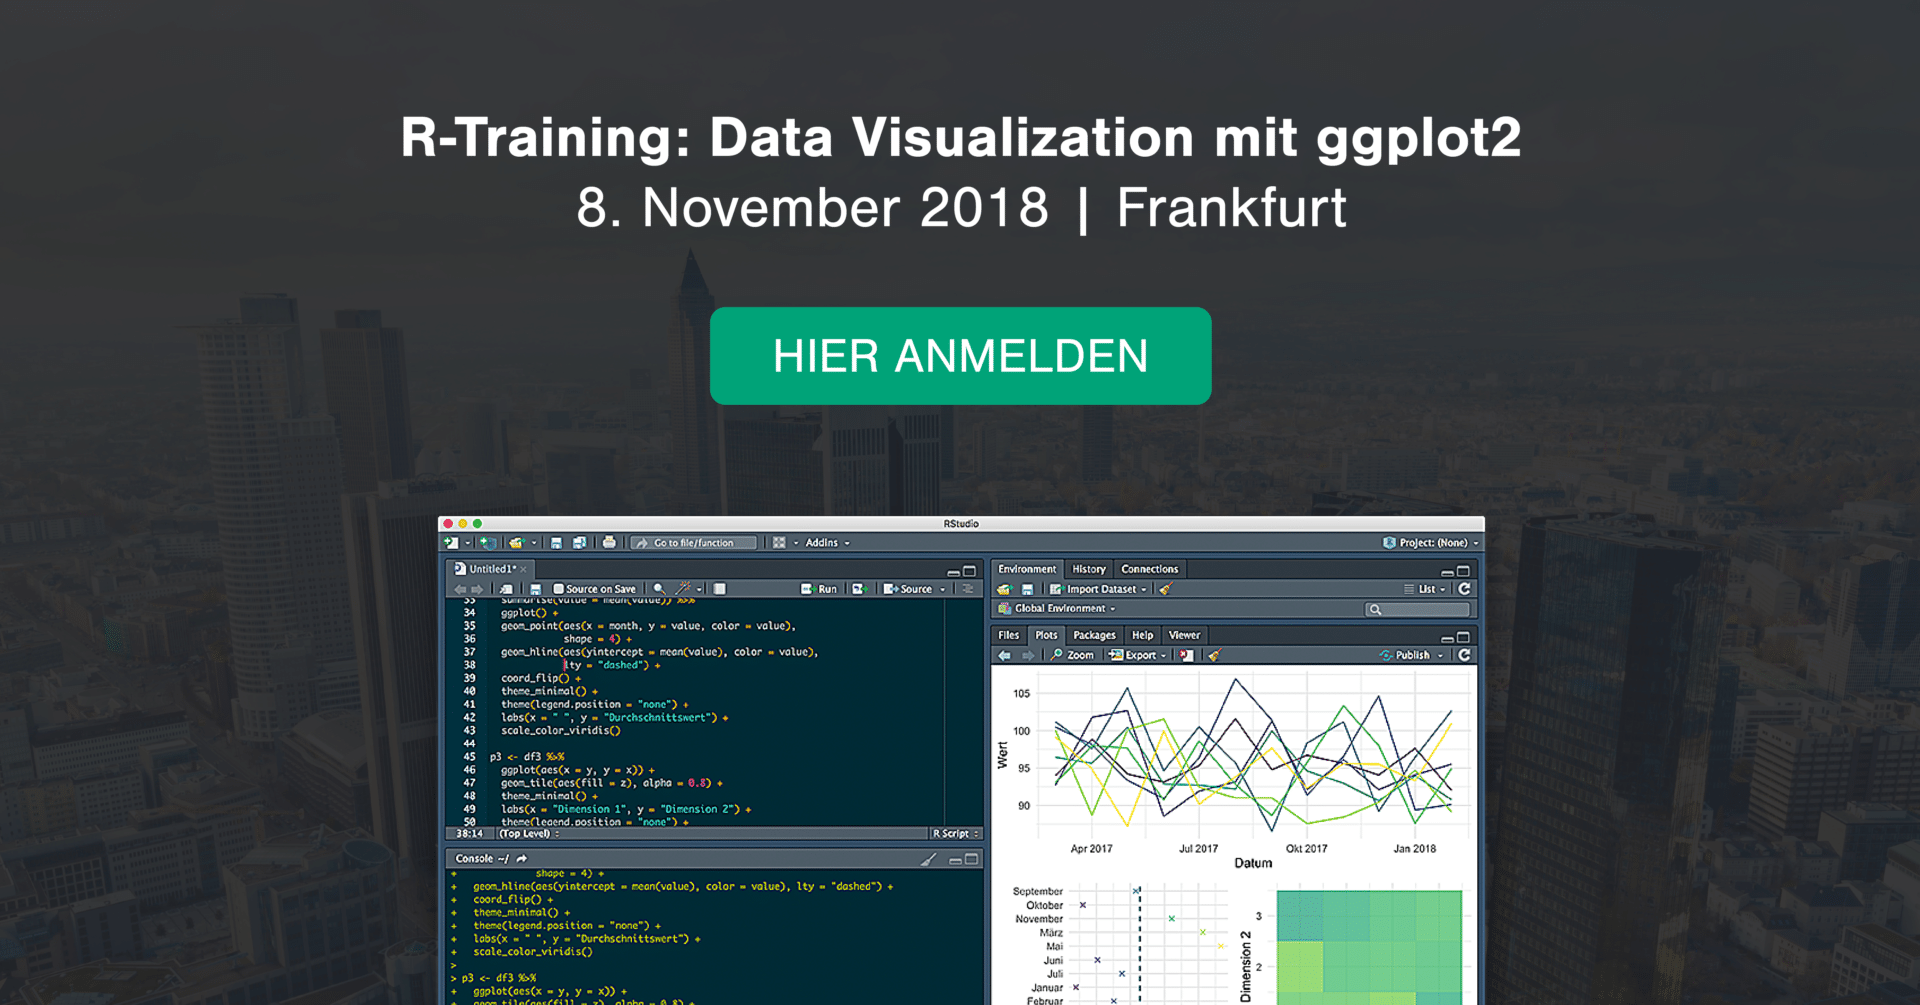
Open Workshop: Data Visualization in R and ggplot2, November 8th in Frankfurt
The first time we at STATWORX are opening our doors for anyone who wants to learn more about data. Our “Data Visualization in R and ggplot2” workshop is designed for R-beginners and provides the perfect mixture between theory and practice. The workshop will be held in german at our office ...
With frequentist methods, would you be able to discuss how important setting agreed sample sizes or…
With frequentist methods, would you be able to discuss how important setting agreed sample sizes or run times is? In the academic world p-hacking is a known thing and I’d argue it’s more prevalent in industry, so would be good to get your view on t...
BatchGetSymbols 2.2
-
One of the main requests I get for package BatchGetSymbols is to allow
the choice of frequency of the financial dataset. I finally got some time to work on it. I just posted a new version of
BatchGetSymbols in CRAN. The major c... [Read more...]
One-Sided Matches in the English Premier League
While some English Premier League matches are bitterly even in nature, others are historically more one-sided. Using the engsoccerdata package in R, I looked at EPL results data from 1888 to 2017, and sought to find the answer to the question: what have been the most uneven matches in the English first ...

neuralnet: Train and Test Neural Networks Using R
CategoriesAdvanced Modeling
Tags
Data Visualisation
Neural Networks
Prediction
R Programming
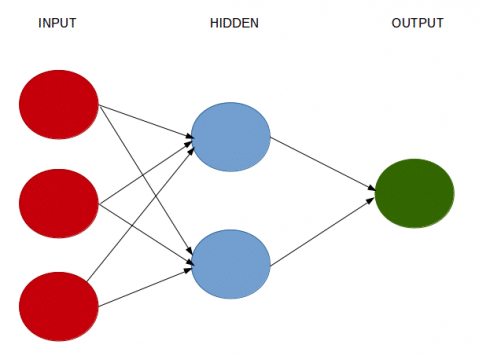
A neural network is a computational system that creates predictions based on existing data. Let us train and test a neural network using the neuralnet library in R. How To Construct A Neural Network? A neural network consists of: Input ...
October, grant proposal season
In 2012, Danielle Herbert, Adrian Barnett, Philip Clarke and Nicholas Graves published an article entitled “on the time spent preparing grant proposals: an observational study of Australian researchers“, whose conclusions had been included in Nature under a more explicit title, “Australia’s grant system wastes time” ! In this study, they included 3700 ...

Readable Code with Pipes
Introduction
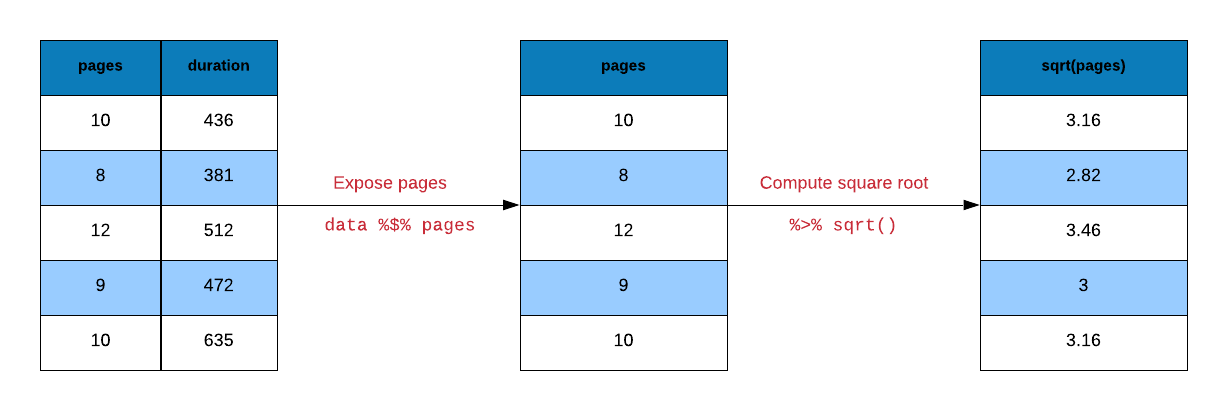
R code contain a lot of parentheses in case of a sequence of multiple operations. When you are dealing with
complex code, it results in nested function calls which are hard to read and maintain. The magrittr package by Stefan Milton Bache provides pipes enabling us to write R ...
Political ideology & New Mexico’s 53rd State Legislature
Ideal points estimation
Legislators in political space
Legislation in 2D political space
Political space and marijuana
A quick geographical perspective
Political ideology in NMSL53
Summary
References
This is the second in a series of posts investigating voting patterns in New Mexico’s 53rd State Legislature (NMSL53). In this post, we ...

BatchGetSymbols 2.2
One of the main requests I get for package BatchGetSymbols is to add the choice of frequency of the financial dataset. Today I finally got some time to work on it. I just posted a new version of BatchGetSymbols in CRAN. The major change is that users can now set ... [Read more...]
Using R to help plan the future of transport. Join MünsteR for our next meetup!
In our next MünsteR R-user group meetup on Tuesday, November 20th, 2018, titled Using R to help plan the future of transport, Mark Padgham will provide an overview of several inter-related R packages for analysing urban dynamics.
You can RSVP here...
R Consortium grant applications due October 31
Since 2015, the R Consortium has funded projects of benefit to, and proposed by, the R community. Twice a year, the R Consortium Infrastructure Steering Committee reviews grant proposals and makes awards based on merit and funds available. (Those funds come, in turn, from the annual dues paid by R Consortium ... [Read more...]
Geocoding with ggmap and the Google API
Some of the most popular articles on the Devil is in the Data show how to visualise spatial data creatively. In the old days, obtaining latitude and longitude required a physical survey, with Google maps, this has become a lot easier. The geocode function from the ggmap package extracts longitude ...

dqsample: A bias-free alternative to base::sample()
For many tasks in statistics and data science it is useful to create a random sample or permutation of a data set. Within R the function base::sample() is used for this task. Unfortunately this function uses a slightly biased algorithm for creating random integers within a given range. Most ...

Big Data-2: Move into the big league:Graduate from R to SparkR
This post is a continuation of my earlier post Big Data-1: Move into the big league:Graduate from Python to Pyspark. While the earlier post discussed parallel constructs in Python and Pyspark, this post elaborates similar and key constructs in R and SparkR. While this post just focuses on the ... [Read more...]
Why do we need human readable tests for a programming language?
Software can save lifes! — R and Python programming language rank in the Top10 of programming languages today. Both languages come out of open-source and research environments and are now moving into the industry. Testing software is really essential in industry. Why to talk about human readable tests?
Let me introduce ...
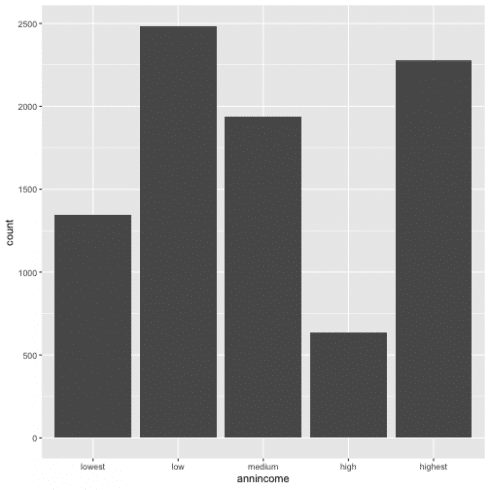
First steps of data exploration and visualization with Tidyverse
CategoriesIntroduction
Tags
Data Visualisation
R Programming
tidyverse
Tips & Tricks
In this post, I will show you, how to use visualization and transformation for exploring your data in R. I will use several functions that come with Tidyverse package. In general, there are two types of variables, categorical and continuous. In ...
Copyright © 2022 | MH Corporate basic by MH Themes