October 2018
Coming on the heels of last week’s RcppTOML 0.1.4 release bringing support for TOML v0.5.0, we have a new release 0.1.5 on CRAN with better encoding support as well as support for the time type.
RcppTOML brings TOML to R. TOML is a file format that... [Read more...]
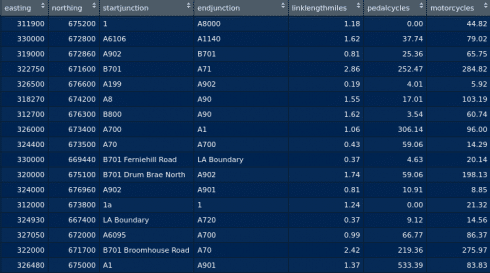
Analysing UK Traffic Trends with PCA
CategoriesVisualizing Data
Tags
Data Visualisation
Principal Component Analysis
R Programming
Tips & Tricks
The PCA (also known as Principal Component Analysis) is quite a handy tool for solving unsupervised learning problems. In other words, PCA can allow us to group unsupervised data into meaningful clusters, and visualize this in a way ...

Parameter Estimation of Binned Data
Section 1: Introduction – The Problem of Binned Data
Hypothetically, say you’re given data like this in Table 1 below, and you’re asked to find the mean:
Group
Frequency
0 to 25
114
25 to 50
76
50 to 75
58
75 to 100
51
100 to 250
140
250 to 500
107
500 to 1000
77
1000 to 5000
124
5000 or more
42
Table 1: Example Binned Data.Border cases go to the lower bin.
The ...

Copula Sampling
Introduction
I was reading about different ways to sample from distributions, and one that caught my eye was based on copulas. There is an answer here, but there seemed to be enough details left to the reader that I wanted to just do it.
One variable example
To start, let’...

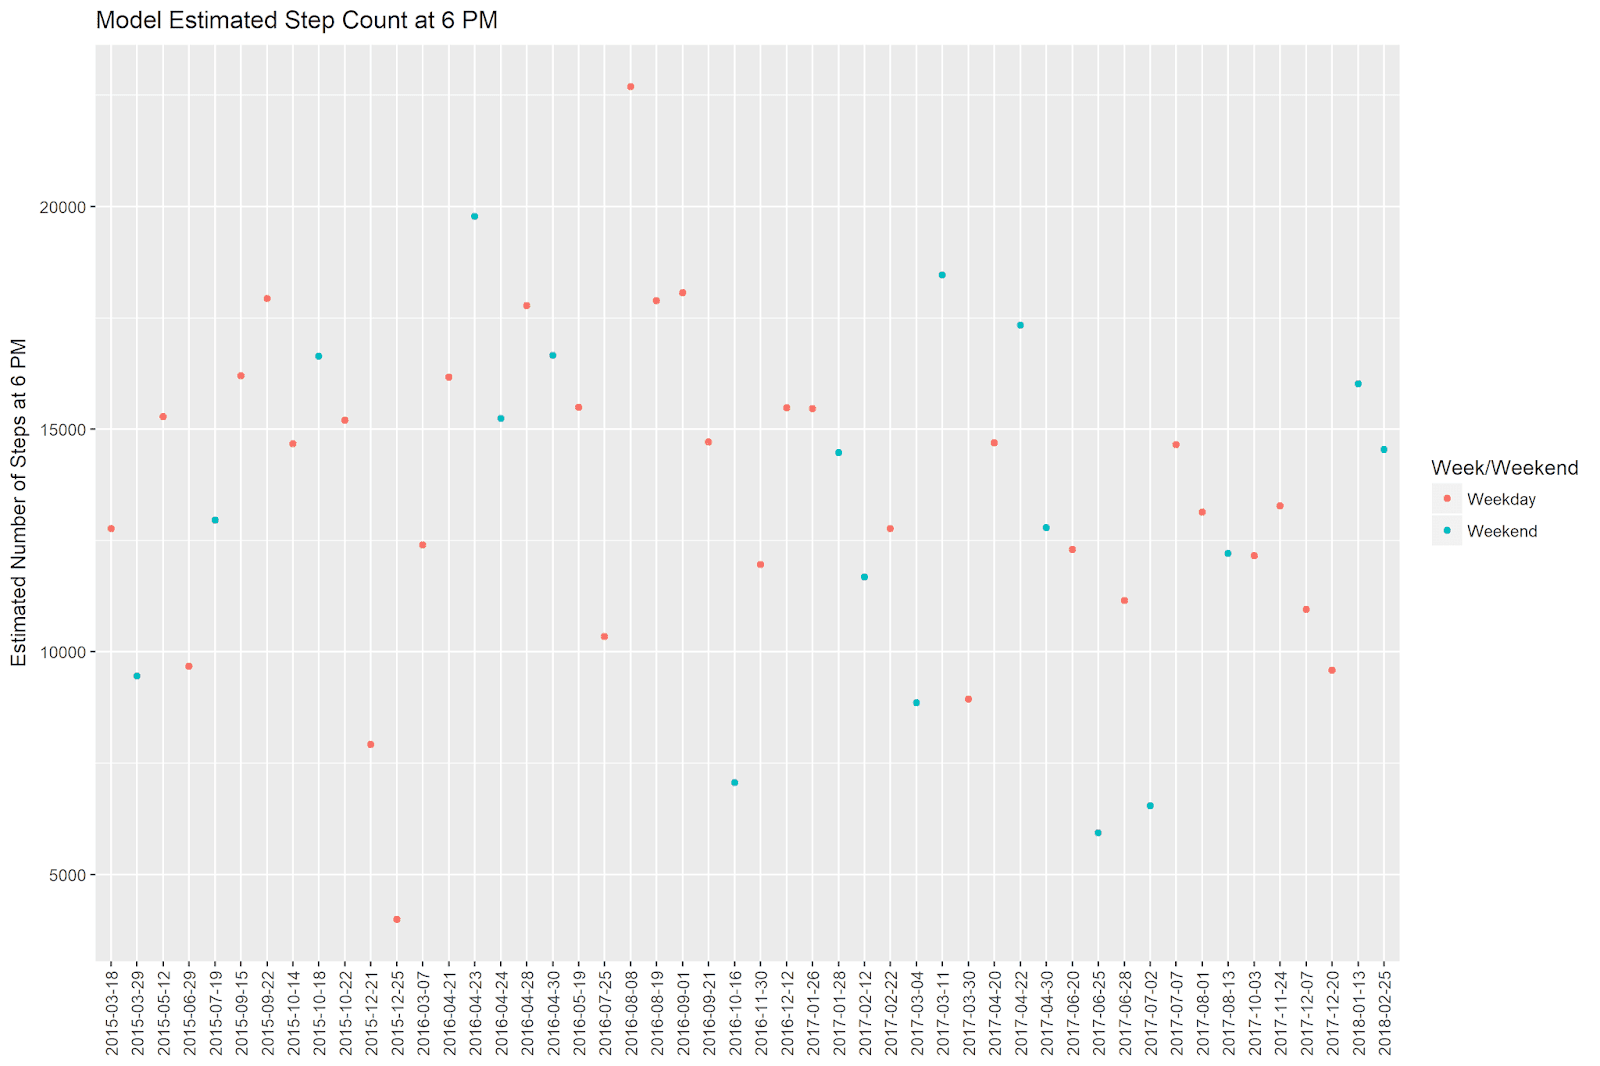
From webscraping data to releasing it as an R package to share with the world: a full tutorial with data from NetHack
If someone told me a decade ago (back before I'd ever heard the term "roguelike") what I'd be doing today, I would have trouble believing this...Yet here we are. pic.twitter.com/N6Hh6A4tWl— Josh Ge (@GridSageGames) June 21, 2018
Abstract
In this post, I am going to show ...

Sharing the Recipe for rOpenSci’s Unconf Ice Breaker
While many people groan at the thought of participating in a group ice breaker activity, we’ve gotten consistent feedback from people who have been to recent rOpenSci unconferences.
Best ice breaker ever!
We’ve had lots of requests for a detailed description of how we do it. This post ...

Communicating results with R Markdown
In my training as a consultant, I learned that long hours of analysis were typically followed by equally long hours of preparing for presentations. I had to turn my complex analyses into recommendations, and my success as a consultant depended on my ability to influence decision makers. I used a ...

Streamlining EDA (exploratory data analysis) with Pivot Billions enhances workflows in R.
Incorporating Pivot Billions into your R analysis workflow can dramatically improve the research cycle and your ability to get results. R is a great statistical analysis tool that a wide variety of data analysts use to analyze and model data. But R has limits on the data it can load ... [Read more...]
How to Highlight 3D Brain Regions
Recently, I was reading Howard et. al., (2018) “Genome-wide meta-analysis of depression in 807,553 individuals identifies 102 independent variants with replication in a further 1,507,153 individuals” and saw a really cool 3D visualization of highlighted brain regions associated with depression:
Source: https://goo.gl/7rY5KVAfter an exhaustive search I couldn’t find any ...
RHL’19 St-Cergue, Switzerland, 25-27 January 2019
(translated from original French version)
The Rencontres Hivernales du Libre (RHL) (Winter Meeting of Freedom) takes place 25-27 January 2019 at St-Cergue.
Swisslinux.org invites the free software community to come and share workshops, great meals an...

RHL’19 St-Cergue, Switzerland, 25-27 January 2019
(translated from original French version)
The Rencontres Hivernales du Libre (RHL) (Winter Meeting of Freedom) takes place 25-27 January 2019 at St-Cergue.
Swisslinux.org invites the free software community to come and share workshops, great meals and ...

Gold-Mining Week 9 (2018)
Week 9 Gold Mining and Fantasy Football Projection Roundup now available. Go get that free agent gold!
The post Gold-Mining Week 9 (2018) appeared first on Fantasy Football Analytics.
[Read more...]
Spooky! Gravedigger in R
Need something to distract the kids while they're waiting to head out Trick-or-Treating? You could have them try out a Creepy Computer Game in R! Engineer and social scientist Dr Peter Provost translated one of the old BASIC games from the classic book Creepy Computer Games into R: just have ...
Now "fread" from data.table can read "gz" and "bz2" files directly
Dear R Programmers,Those who all use data.table for your data readings, good news is that now, fread supports direct reading of zip formats like"gz" and "bz2".To all my followers and readers, as mentioned earlier several times, good way for saving both space and reading fast is ... [Read more...]
How to run R from the Task Scheduler
In a prior post, we covered how to run Python from the Task Scheduler on Windows. This article is similar, but it’ll show how to run R from the Task Scheduler, instead. Similar to before, let’s first cover how to R from the command line, as knowing this ...

Multilevel Modeling Solves the Multiple Comparison Problem: An Example with R
Multiple comparisons of group-level means is a tricky problem in statistical inference. A standard practice is to adjust the threshold for statistical significance according to the number of pairwise tests performed. For example, according to the widely-known Bonferonni method, if we have 3 different groups for which we want to compare ...

Thoughts on the NHS-R conference
It’s been a few weeks since the first NHS-R conference was held in Birmingham.
I co-presented a couple of workshops with Neil Pettinger on visualising patient flow, covering the following
importing from Excel (and connecting to SQ... [Read more...]
Data exploration with alluvial plots – An introduction to easyalluvial
Introduction
easyalluvial
Features
Install
Wide Format
Sample data
alluvial_wide()
Long Format
Sample Data
alluvial_long()
General
Missing Data
Colors
Connect Flows to observations in original data
ggplot2 manipulations
Introduction
Alluvial plots are a form of sankey diagrams that are a great tool for exploring categorical data. They group categorical ...

Comparing Medians and Inter-Quartile Ranges Using the Box Plot
The box plot is useful for comparing the quartiles of quantitative variables. More specifically, lower and upper ends of a box (the hinges) are defined by the first (Q1) and third quartile (Q3). The median (Q2) is shown as a horizontal line within the box. Additionally, outliers are indicated by ...

Copyright © 2022 | MH Corporate basic by MH Themes