August 2018

Fitting removal models with the detect R package

August 30, 2018 | Peter Solymos

In a paper recently published in the Condor, titled Evaluating time-removal models for estimating availability of boreal birds during point-count surveys: sample size requirements and model complexity, we assessed different ways of controlling for point-count duration in bird counts using data from the Boreal Avian Modelling Project. As the title ... [Read more...]

Spotify Anal-*YE*-sis

August 29, 2018 | R on Home

Introduction Exploratory Data Analysis Load Packages Import Data Danceability Valence Other Variables Clustering Hierarchical Clustering Principle Component Analysis Introduction As the Internet of Things (IoT) landscape continues to grow, practically everyone and everything, it seems, is compiling data or at least generating statistics for any variable imaginable. And music is ...
[Read more...]

Bootstrapping clustered data

August 29, 2018 | R on Abhijit Dasgupta

When evaluating the sampling variability of different statistics, I’ll often use the bootstrap procedure to resample my data, compute the statistic on each sample, and look at the distribution of the statistic over several bootstrap samples. In principle, the bootstrap is straightforward to do. However, if you have correlated ...
[Read more...]

Slack and Plumber, Part One

August 29, 2018 | R Views

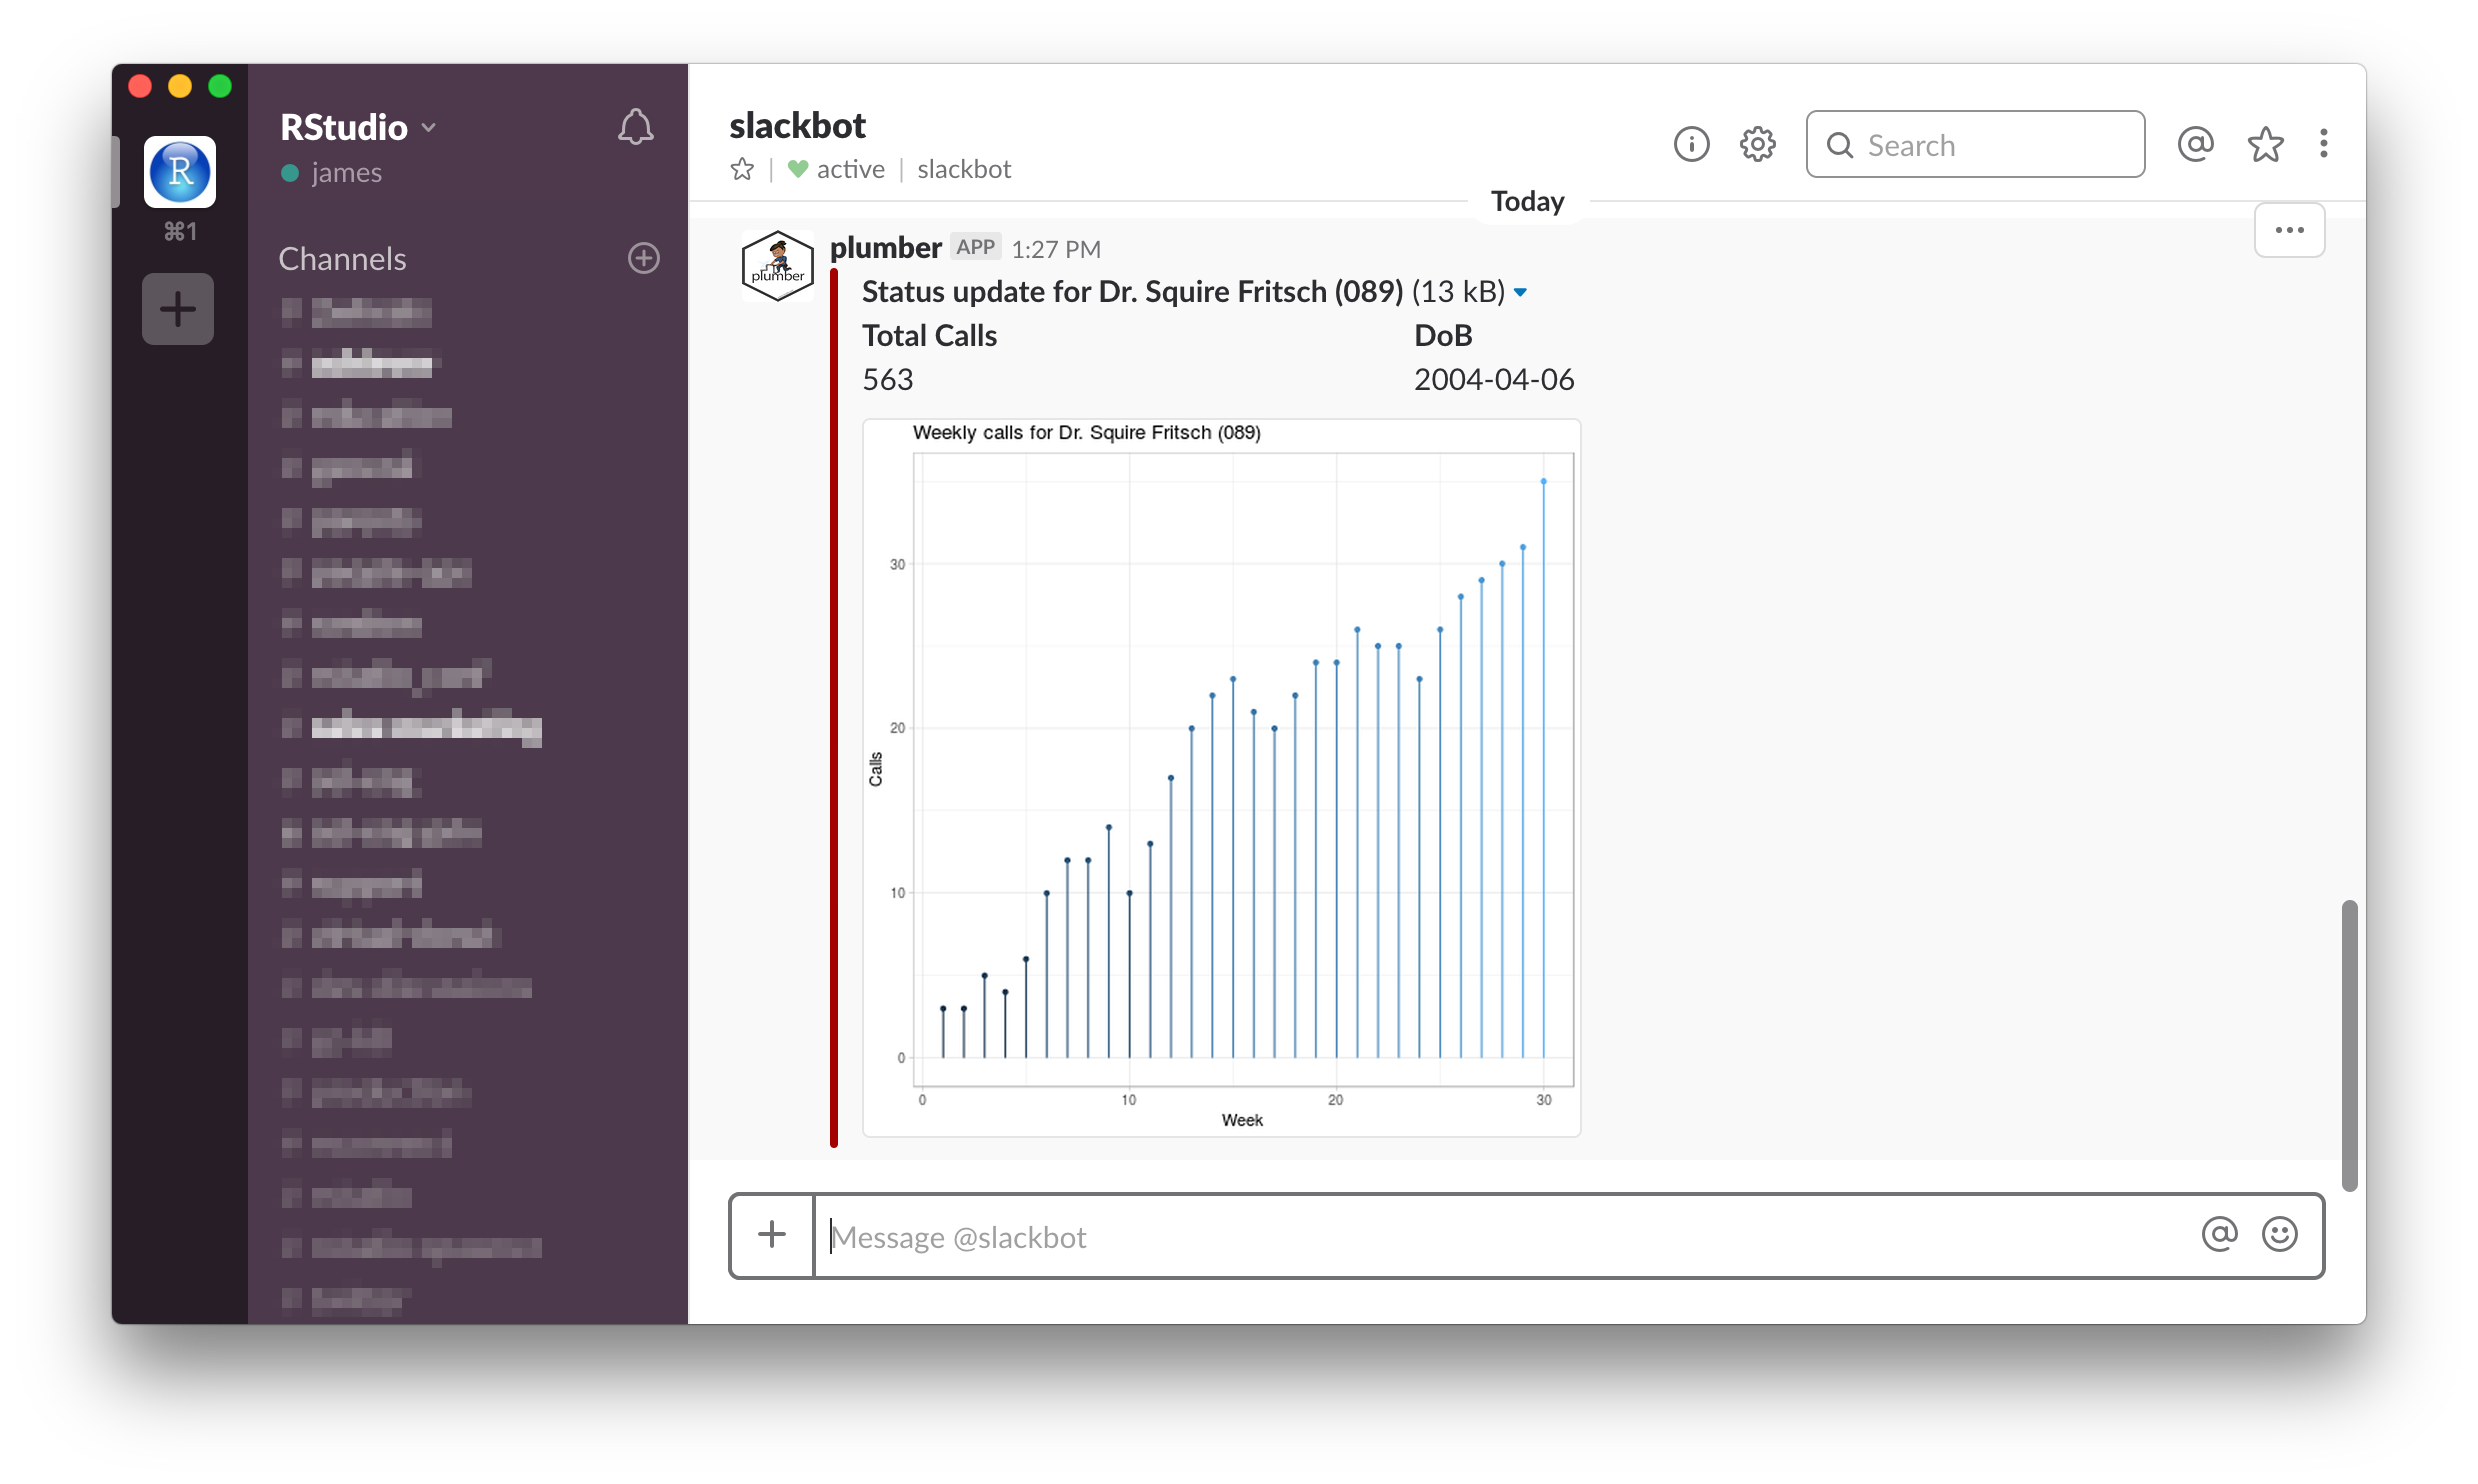
In the previous post, we introduced plumber as a way to expose R processes and programs to external systems via REST API endpoints. In this post, we’ll go further by building out an API that powers a Slack slash command, all from within R using plumber. A subsequent post ...
[Read more...]

IMS workshop [day 3]

August 29, 2018 | xi'an

I made the “capital” mistake of walking across the entire NUS campus this morning, which is quite green and pretty, but which almost enjoys an additional dimension brought by such an intense humidity that one feels having to get around this humidity!, a feature I have managed to completely erase ...
[Read more...]

Podcast recommendations

August 29, 2018 | Jumping Rivers

Anyone who has a long commute or who has to travel with work knows the importance of podcasts. Podcasts allow you turn otherwise useless time, into something both productive and interesting. In this blog post, we’ll describe some of our favourite podcasts. This list isn’t meant to be ...
[Read more...]

Transfer data from R to Python with PyRserve and Bio7

August 29, 2018 | Marcel Austenfeld

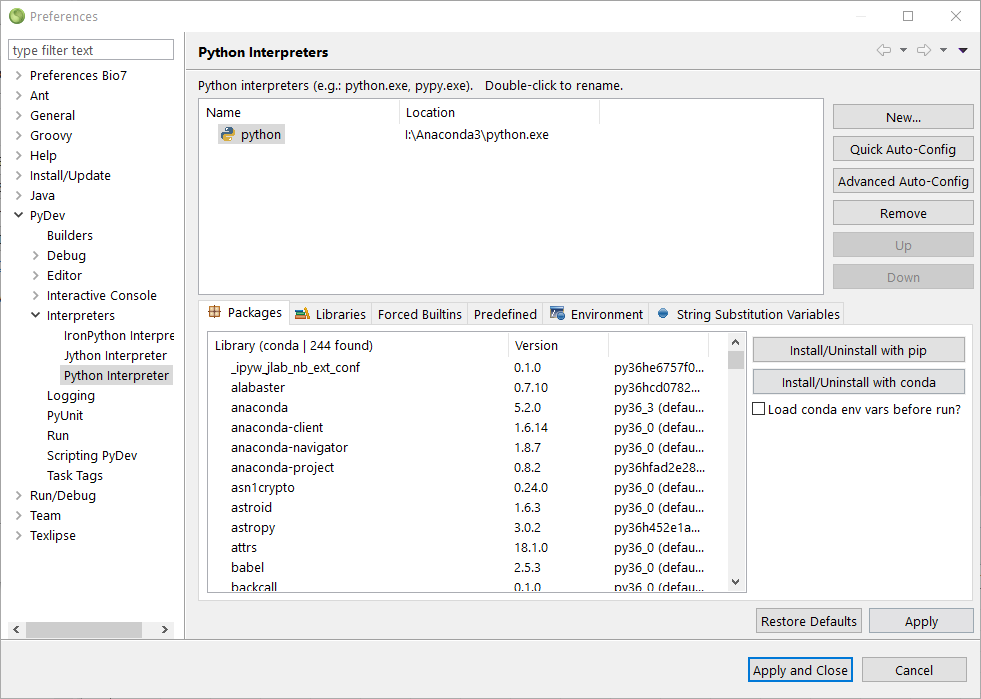
29.08.2018 Recently I discovered the package PyRserve for Python which connects Python with R using Rserve. This is extremly useful because Bio7 already integrates Rserve and has special GUI interfaces available to transfer, e.g.,  data from spreadsheets, ImageJ image and selection data (also georeferenced),  Java simulation data, etc. With this ...
[Read more...]

Playing around with RStudio Package Manager

August 29, 2018 | Colin Fay

Managing packages in production is a lot of work: you have to juggle between versions, internal packages, CRAN updates, Bioconductor, GitHub sources… Let’s have a look into RStudio Package Manager, one of the tools available that helps you dealing with this. What is love RSPM (Baby don’t hurt ...
[Read more...]

More Flexible Ordinal Outcome Models

August 28, 2018 | statcompute

In the previous post (https://statcompute.wordpress.com/2018/08/26/adjacent-categories-and-continuation-ratio-logit-models-for-ordinal-outcomes), we’ve shown alternative models for ordinal outcomes in addition to commonly used Cumulative Logit models under the proportional odds assumption, which are also known as Proportional Odds model. A potential drawback of Proportional Odds model is the lack of flexibility ... [Read more...]

Videos from NYC R Conference

August 28, 2018 | David Smith

The videos from the NYC R conference have been published, and there are so many great talks there to explore. I highly recommend checking them out: you'll find a wealth of interesting R applications, informative deep dives on using R (and a few other applications as well), and some very ... [Read more...]

Visualization of Tumor Response – Spider Plots

August 28, 2018 | jyothi

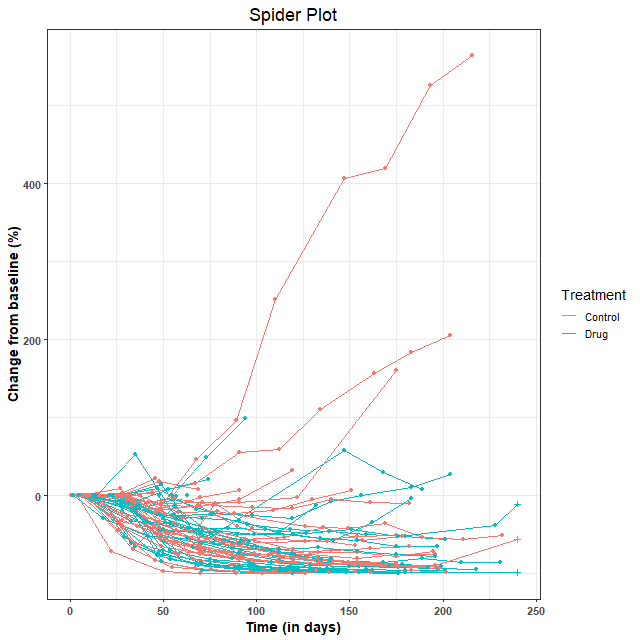
A collection of some commonly used and some newly developed methods for the visualization of outcomes in oncology studies include Kaplan-Meier curves, forest plots, funnel plots, violin plots, waterfall plots, spider plots, swimmer plot, heatmaps, circos plots, transit map diagrams and network analysis diagrams (reviewed here). Previous articles in this ...
[Read more...]
1 2 3 4 14

Never miss an update!
Subscribe to R-bloggers to receive
e-mails with the latest R posts.
(You will not see this message again.)

Click here to close (This popup will not appear again)