July 2018

Using R to Generate Live World Cup Notifications

July 5, 2018 | Open Analytics

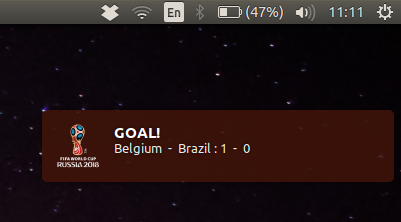
Here in Belgium, World Cup fever is at fever pitch, but with matches starting during work hours, how is a desk worker supposed to follow along? By leaving the R environment? Blasphemy. Today we show how to use R to generate live desktop notifications for The Beautiful Game. A notification ...
[Read more...]

Basic Generalised Additive Model In Ecology; Exercise

July 5, 2018 | Hanif Kusuma

Generalised Additive Models (GAM) are non-parametric models that add smoother to the data. On this exercise, we will look at GAMs using cubic spline using the mgcv package. Dataset used can be downloaded here. The dataset is the experiment result at grassland richness over time in Yellowstone National Park (Skkink ... [Read more...]

Extreme Learning Machine

July 4, 2018 | mlampros

As of 2018-06-17 the elmNN package was archived and due to the fact that it was one of the machine learning functions that I used when I started learning R (it returns the output results pretty fast too) plus that I had to utilize the package last week for ... [Read more...]

Why R Conference

July 4, 2018 | Quay Au

This July we had the great honor to present mlr and its ecosystem at the http://whyr2018.pl/ in Wroclaw in Poland. You can find the slides here. We want to thank the organizers for inviting us, providing us with great food and coffee and also many thanks to all ...
[Read more...]

A First Look at NIMBLE

July 4, 2018 | R Views

Writing a domain-specific language (DSL) is a powerful and fairly common method for extending the R language. Both ggplot2 and dplyr, for example, are DSLs. (See Hadley’s chapter in Advanced R for some elaboration.) In this post, I take a first look at NIMBLE (Numerical Inference for Statistical Models ...
[Read more...]

Life (expectancy), animated

July 4, 2018 | Rstats on Jakub Nowosad's website

Global socio-economic data is easily accessible nowadays. Just type the indicator of interest and the name of the country in your preferred search engine and you can find its value, sometimes also an additional plot or a map. But what about when you want to go further and (for example): ...
[Read more...]

New rWind release on CRAN! (v1.0.2)

July 4, 2018 | Javi Fernández-López

Hi there!Just a few lines to inform you about the new release of rWind R package (v1.0.2). This version have several new features. Here you have an example of one of them, the function wind.dl_2 to download time series of wind data. In this example we create a ... [Read more...]

hitting a wall

July 4, 2018 | xi'an

Once in a while, or a wee bit more frequently (!), it proves impossible to communicate with a contributor of a question on X validated. A recent instance was about simulating from a multivariate kernel density estimate where the kernel terms at x¹,x²,… are Gaussian kernels applied to the inverses ...
[Read more...]

R null values: NULL, NA, NaN, Inf

July 4, 2018 | tomaztsql

R language supports several null-able values and it is relatively important to understand how these values behave, when making data pre-processing and data munging. In general, R supports: NULL NA NaN Inf / -Inf NULL is an object and is returned when an expression or function results in an undefined value. ...
[Read more...]

The Devil is in the Data is moving

July 4, 2018 | Peter Prevos

Dear readers, I have been consolidating my online presence and the Devil is in the Data blog has moved to the Lucid Manager website. This will be the last post on this domain and I hope to see you again... Continue Reading → The post The Devil is in the Data ... [Read more...]

Rough looking figures from R

July 4, 2018 | aghaynes

A recent blog post regarding data visualization had some barplots I liked the look of (aesthetically…for research purposes, they wouldn’t be suitable). They look as if they’ve be coloured in with a pencil, rather than having solid blocks of colour… I wondered whether it’s possible with ... [Read more...]

RStudio Anatomy

July 4, 2018 | melliferrari

RStudio makes R easier to use. It includes a code editor, debugging & visualization tools. I love it but when beginners launch RStudio they are sometimes confused by all the panes and tabs. Here I have tried to give a quick visual guide to the anatomy of RStudio for people new ... [Read more...]

Data Summary in One Go

July 3, 2018 | Pradeep Mavuluri

Data Description R CodeThis function and package is long pending for publishing from my side, this time expecting soon to put as package for quick usage, before that thought releasing it for feedback.Below function provides R code for getting data des...
[Read more...]

How to Create Automated Analysis Using R?

July 3, 2018 | n.ashutosh

Have you found yourself repeating the same analysis for different groups in your data? And have you wondered about a better way of doing so in R? I have this problem often. RMarkdown, knitr, and RStudio make generating such automated reports very easy. You need two things: A parent file ... [Read more...]
1 13 14 15 16 17

Never miss an update!
Subscribe to R-bloggers to receive
e-mails with the latest R posts.
(You will not see this message again.)

Click here to close (This popup will not appear again)