July 2018

Mango at Insurance Data Science Conference

July 15, 2018 | Mango Solutions

Ruth Thomson, Strategic Innovation & Strategic Advice On Monday, I am very much looking forward to joining the panel discussion at the Insurance Data Science Conference at the Cass Business School alongside Kristen Dardia from Verisk Analytics and Hadrien Dykiel from R Studio. If you’re reading this on the 16th ... [Read more...]

Seasonal decomposition of short time series

July 13, 2018 | R on Rob J Hyndman

Many users have tried to do a seasonal decomposition with a short time series, and hit the error “Series has less than two periods”. The problem is that the usual methods of decomposition (e.g., decompose and stl) estimate seasonality using at least as many degrees of freedom as there ...
[Read more...]

Concentration of Senate Representation

July 13, 2018 | R on carl b frederick

Recently saw this tweet I want to repeat a statistic I use in every talk: by 2040 or so, 70 percent of Americans will live in 15 states. Meaning 30 percent will choose 70 senators. And the 30% will be older, whiter, more rural, more male than the 70 percent. Unsettling to say the least https://t....
[Read more...]

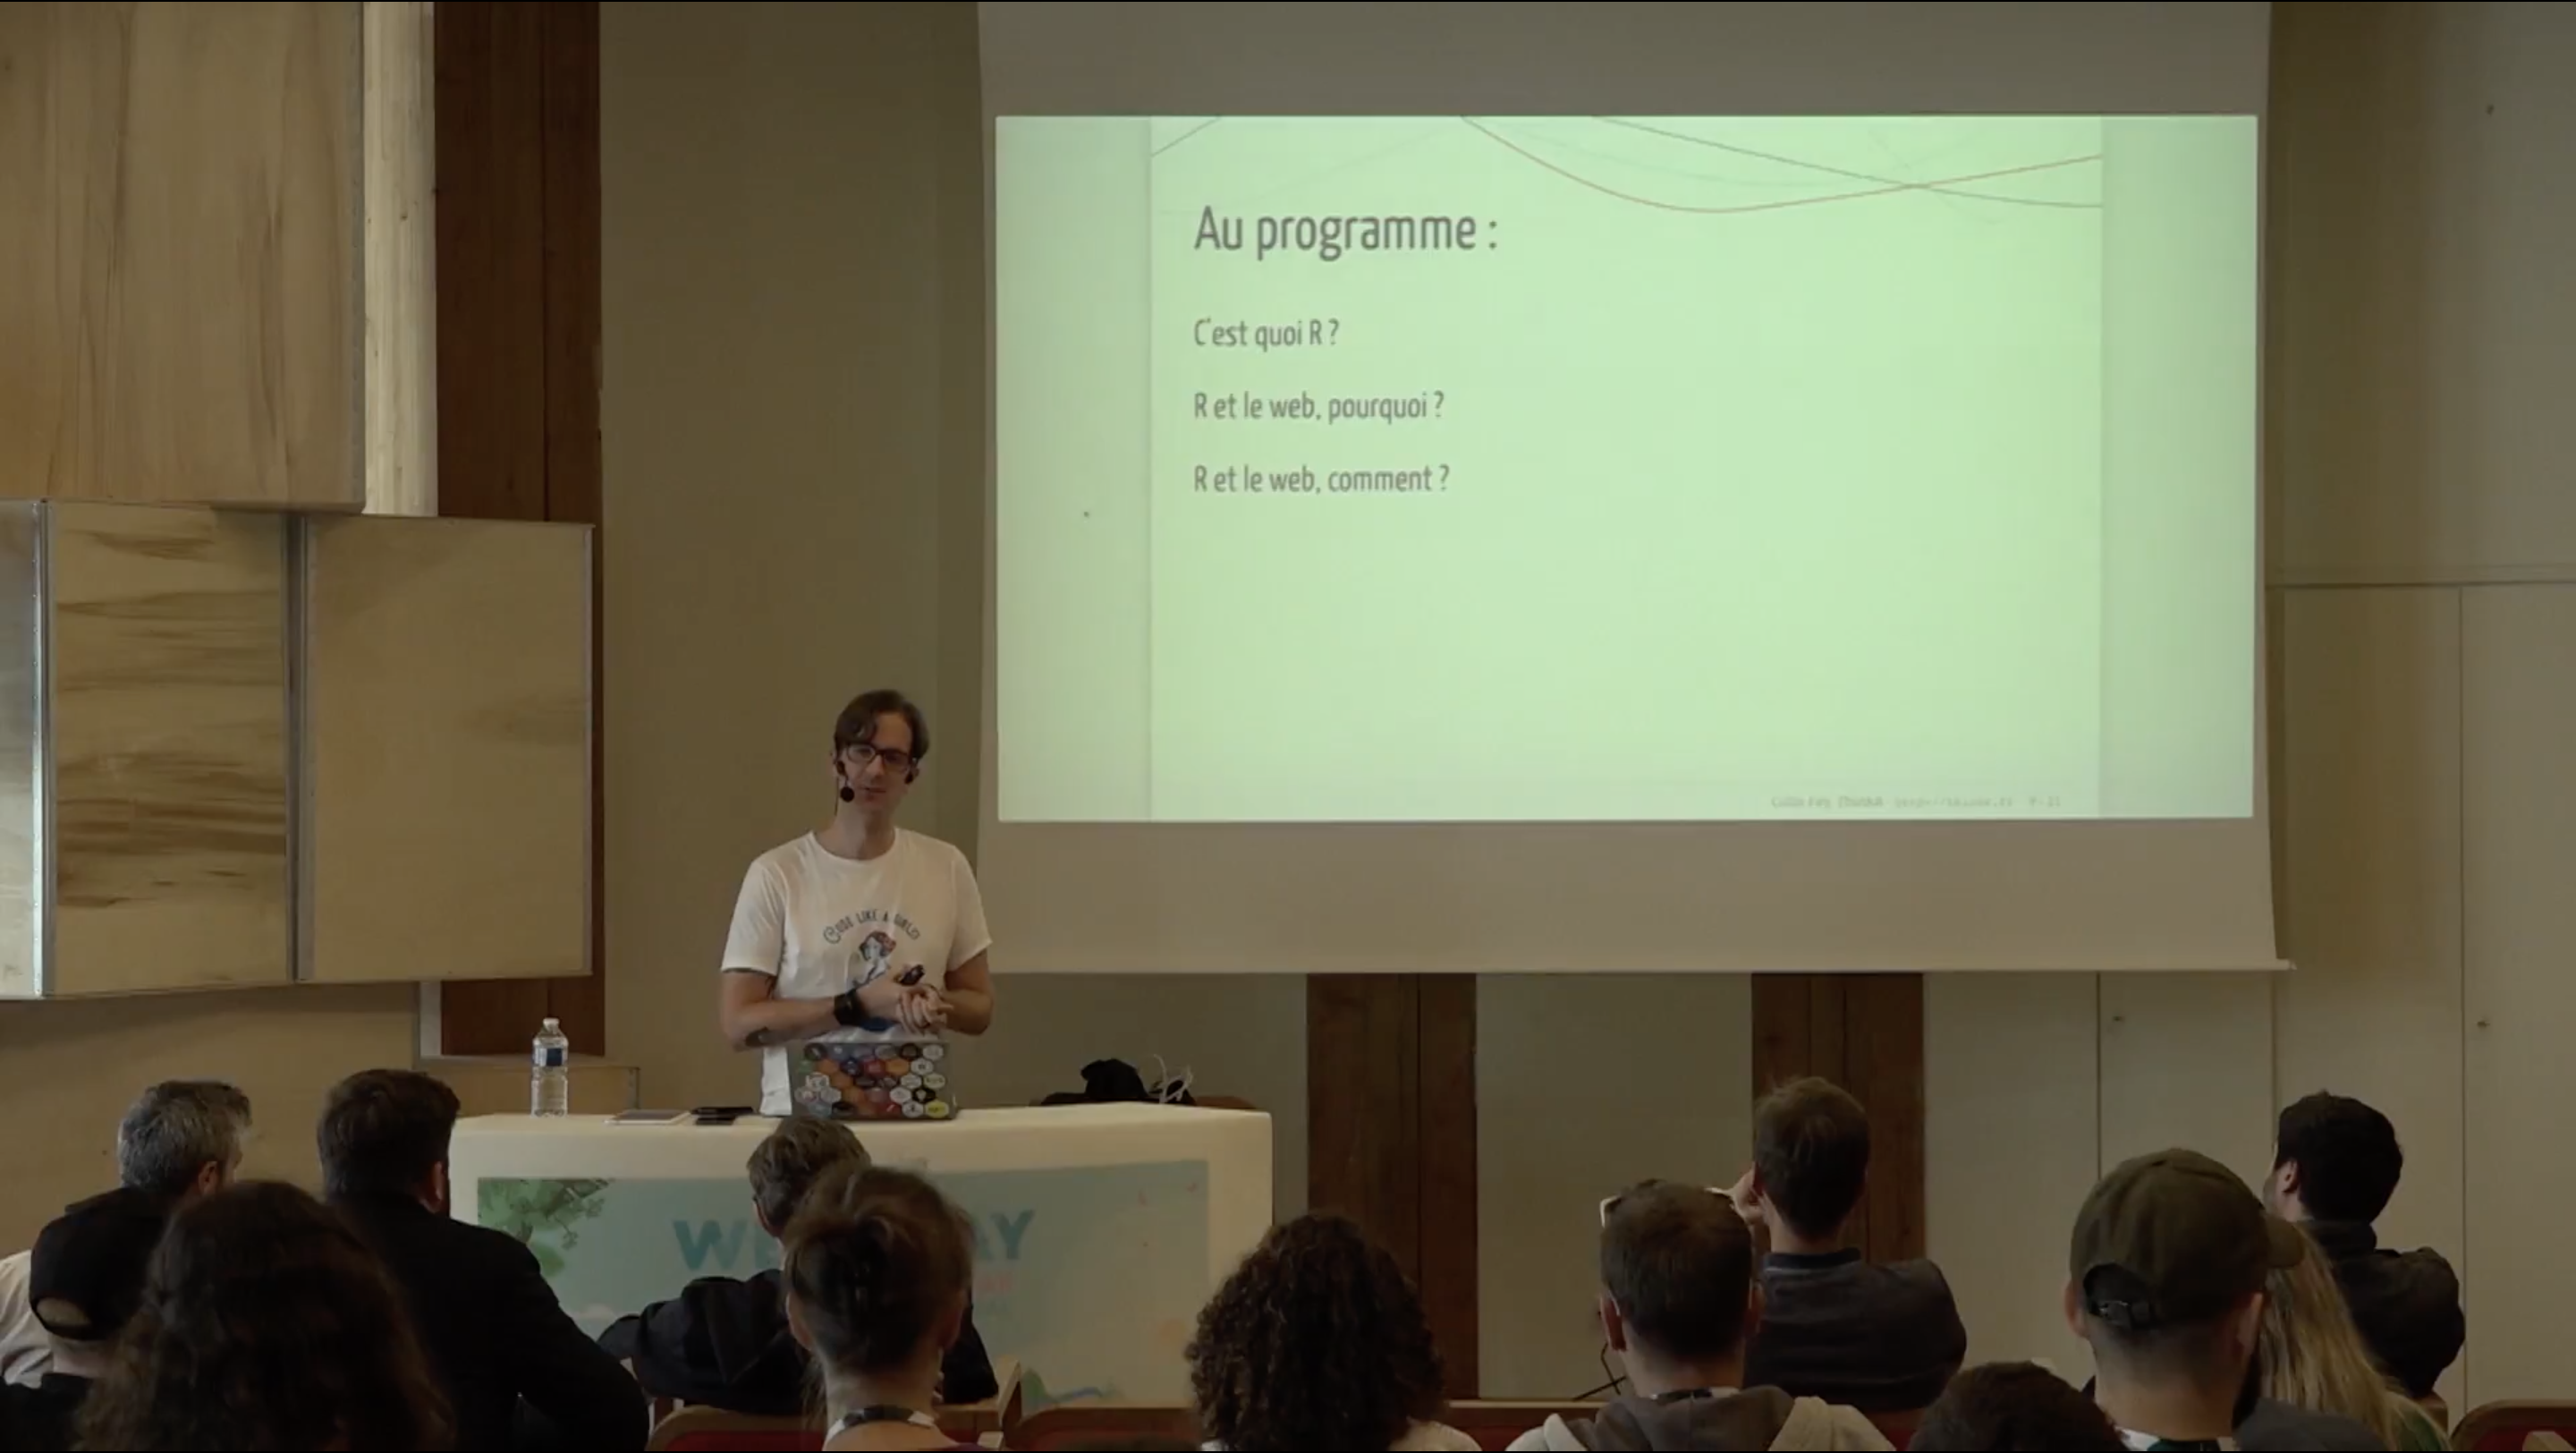
[Web2Day] Producing web content with R

July 13, 2018 | Colin Fay

Earlier this week, my talk at the Web2Day conference was put online. Here is an english summary for those who don’t understand french :) Disclaimer: this talk has been given during a conference about web technologies. In other word,in front of a crowd that has never / hardly heard ...
[Read more...]

Why I rarely use apply

July 13, 2018 | Florian Privé

In this short post, I talk about why I’m moving away from using function apply. With matrices It’s okay to use apply with a dense matrix, although you can often use an equivalent that is faster. N
[Read more...]

Variable vs. Participant-wise Standardization

July 13, 2018 | Dominique Makowski

The data Standardize Effect of Standardization At a general level At a participant level Distribution Correlation Test Conclusion Credits Previous blogposts To make sense of their data and effects, psychologists often standardize (Z-score) their variables. However, in repeated-measures designs, there are three ways of standardizing data: Variable-wise: The most common ...
[Read more...]

Stencila – an office suite for reproducible research

July 13, 2018 | Emily Packer

Stencila launches the first version of its (open source) word processor and spreadsheet editor designed for researchers. By Michael Aufreiter, Substance, and Aleksandra Pawlik and Nokome Bentley, Stencila Stencila is an open source office suite designed for researchers. It allows the authoring of interactive, data-driven publications in visual interfaces, similar ...
[Read more...]

Is GINA really about to die?!?

July 13, 2018 | Nathan

Introduction During a recent negotiation of an informed consent form for use in a clinical trial, the opposing lawyer and I skirmished over the applicability of the Genetic Information Nondiscrimination Act of 2008, commonly known as GINA. Specifically, the opposing lawyer thought that guidance issued by the U.S. Office for ... [Read more...]

Introducing the Kernelheaping Package II

July 13, 2018 | INWT-Blog-RBloggers

In the first part of Introducing the Kernelheaping Package I showed how to compute and plot kernel density estimates on rounded or interval censored data using the Kernelheaping package. Now, let’s make a big leap forward to the 2-dimensional case. Interval censoring can be generalised to rectangles or alternatively ...
[Read more...]

Using Machine Learning for Causal Inference

July 13, 2018 | Markus Berroth

Machine Learning (ML) is still an underdog in the field of economics. However, it gets more and more recognition in the recent years. One reason for being an underdog is, that in economics and other social sciences one is not only interested in predicting but also in making causal inference. ...
[Read more...]

Variational Gaussian Mixtures for Face Detection

July 12, 2018 | --Jean Arreola--

Mixture model A Gaussian mixture model is a probabilistic way of representing subpopulations within an overall population. We only observe the data, not the subpopulation from which observation belongs. We have $N$ random variables observed, each distributed according to a mixture of K gaussian components. Each gaussian has its own ...
[Read more...]
1 8 9 10 11 12 17

Never miss an update!
Subscribe to R-bloggers to receive
e-mails with the latest R posts.
(You will not see this message again.)

Click here to close (This popup will not appear again)