May 2018

The Power of Standards and Consistency

May 26, 2018 | hrbrmstr

I’m going to (eventually) write a full post on the package I’m mentioning in this one : osqueryr🔗. The TLDR on osqueryr is that it is an R DBI wrapper (that has just enough glue to also be plugged into dbplyr) for osquery🔗. The TLDR on osquery is that ...
[Read more...]

The Best Rstudio Snippet Ever!

May 26, 2018 | Vincent GUYADER

Because I was tired of typing the same thing over and over. I finally took the time to make myself a little Rstudio snippet. To do this just go to Tools __ global Option __ code __ edit snippet and to add in the list these few lines : snippet aa ${1:dataset} % ${0} This is ... [Read more...]

Tips for great graphics

May 26, 2018 | aghaynes

R is a great program for generating top-notch graphics. But to get the best out of it, you need to put in a little more work. Here are a few tips for adapting your R graphics to make them look a little better. 1) Dont use the “File/Save as…/” menu. ...
[Read more...]

WVPlots now at version 1.0.0 on CRAN!

May 25, 2018 | John Mount

Nina Zumel and I have been working on packaging our favorite graphing techniques in a more reusable way that emphasizes the analysis task at hand over the steps needed to produce a good visualization. We are excited to announce the WVPlots is now at version 1.0.0 on CRAN! The idea is: ...
[Read more...]

Analyzing Jeopardy in R – Part 2

May 25, 2018 | Dr. Jack Davis

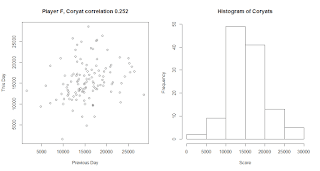
My previous Jeopardy analyzer was built using a base of about 30 daily Coryat scores. This one has more than 1600 scores that were either recorded directly, e-mailed to me, or scraped from the forum at jboard.tv . Here we look at the consistency of tou...
[Read more...]

Reflections on the ROpenSci Unconference

May 25, 2018 | David Smith

I had an amazing time this week participating in the 2018 ROpenSci Unconference, the sixth annual ROpenSci hackathon bringing together people to advance the tools and community for scientific computing with R. It was so inspiring to be among such a talented and dedicated group of people — special kudos goes to ... [Read more...]

How to plot with patchwork

May 25, 2018 | Euthymios Kasvikis

INTRODUCTION The goal of patchwork is to make it simple to combine separate ggplots into the same graphic. As such it tries to solve the same problem as gridExtra::grid.arrange() and cowplot::plot_grid but using an API that incites exploration and iteration. Installation You can install patchwork from ... [Read more...]

UK Local Elections 2017

May 24, 2018 | Fergus Taylor

Following a very interesting post I’d found on twitter by Paul Campbell, I was curious to try to recreate the plots involved myself. Plotting a coloured point as a representation of 100 votes in each ward is interesting, it gives a surprising feel for the sense of party proportions in ...
[Read more...]

Plotting Background Data

May 24, 2018 | Analysis of AFL

One of the best things about the online R community is there are lots and lots of great people to follow online especially. One person I follow dataandme consistently links great how to do things on R tutorials. Recently I saw this post where she linked a post by drsimonj ...
[Read more...]

Safe Disposal of Unexploded WWII Bombs

May 24, 2018 | Theory meets practice...

Abstract Unexploded WWII bombs are ticking threats despite being dropped more than 70 years ago. In this post we explain how statistical methods are used to plan the search and disposal of unexploded WWII bombs. In particular we consider and exemplify the non-parametric nearest neighbour distance (NND) method implemented in the ...
[Read more...]
1 2 3 4 5 16

Never miss an update!
Subscribe to R-bloggers to receive
e-mails with the latest R posts.
(You will not see this message again.)

Click here to close (This popup will not appear again)