May 2018

Finalfit, knitr and R Markdown for quick results

May 22, 2018 | Ewen Harrison

Thank you for the many requests to provide some extra info on how best to get finalfit results out of RStudio, and particularly into Microsoft Word. Here is how. Make sure you are on the most up-to-date version of finalfit. [crayon-5b04b4e219aae502138484/] What follows is for demonstration ...
[Read more...]

The use of R in official statistics conference 2018

May 22, 2018 | mark

On September 12-14 the 6th international conference on the use of R in official statistics (#uRos2018) will take place at the Dutch National Statistical Office in Den Haag, the Netherlands. The conference is aimed at producers and users of official … Continue reading → [Read more...]

How Has Taylor Swift’s Word Choice Changed Over Time?

May 22, 2018 |

How Has Taylor Swift's Word Choice Changed Over Time?Sunday night was a big night for Taylor Swift - not only was she nominated for multiple Billboard Music Awards; she took home Top Female Artist and Top Selling Album. So I thought it was a good time for some more ...
[Read more...]

Automagic epi curve plotting: part I

May 22, 2018 | Chris

Have you ever wanted to schedule tasks from R and run routine analytics repeatedly at regular intervals? Here's the best way to do it. The post Automagic epi curve plotting: part I appeared first on Doodling in Data.
[Read more...]

Why R? 2018 Conf – CfP ends May 25th

May 22, 2018 | Marcin Kosiński

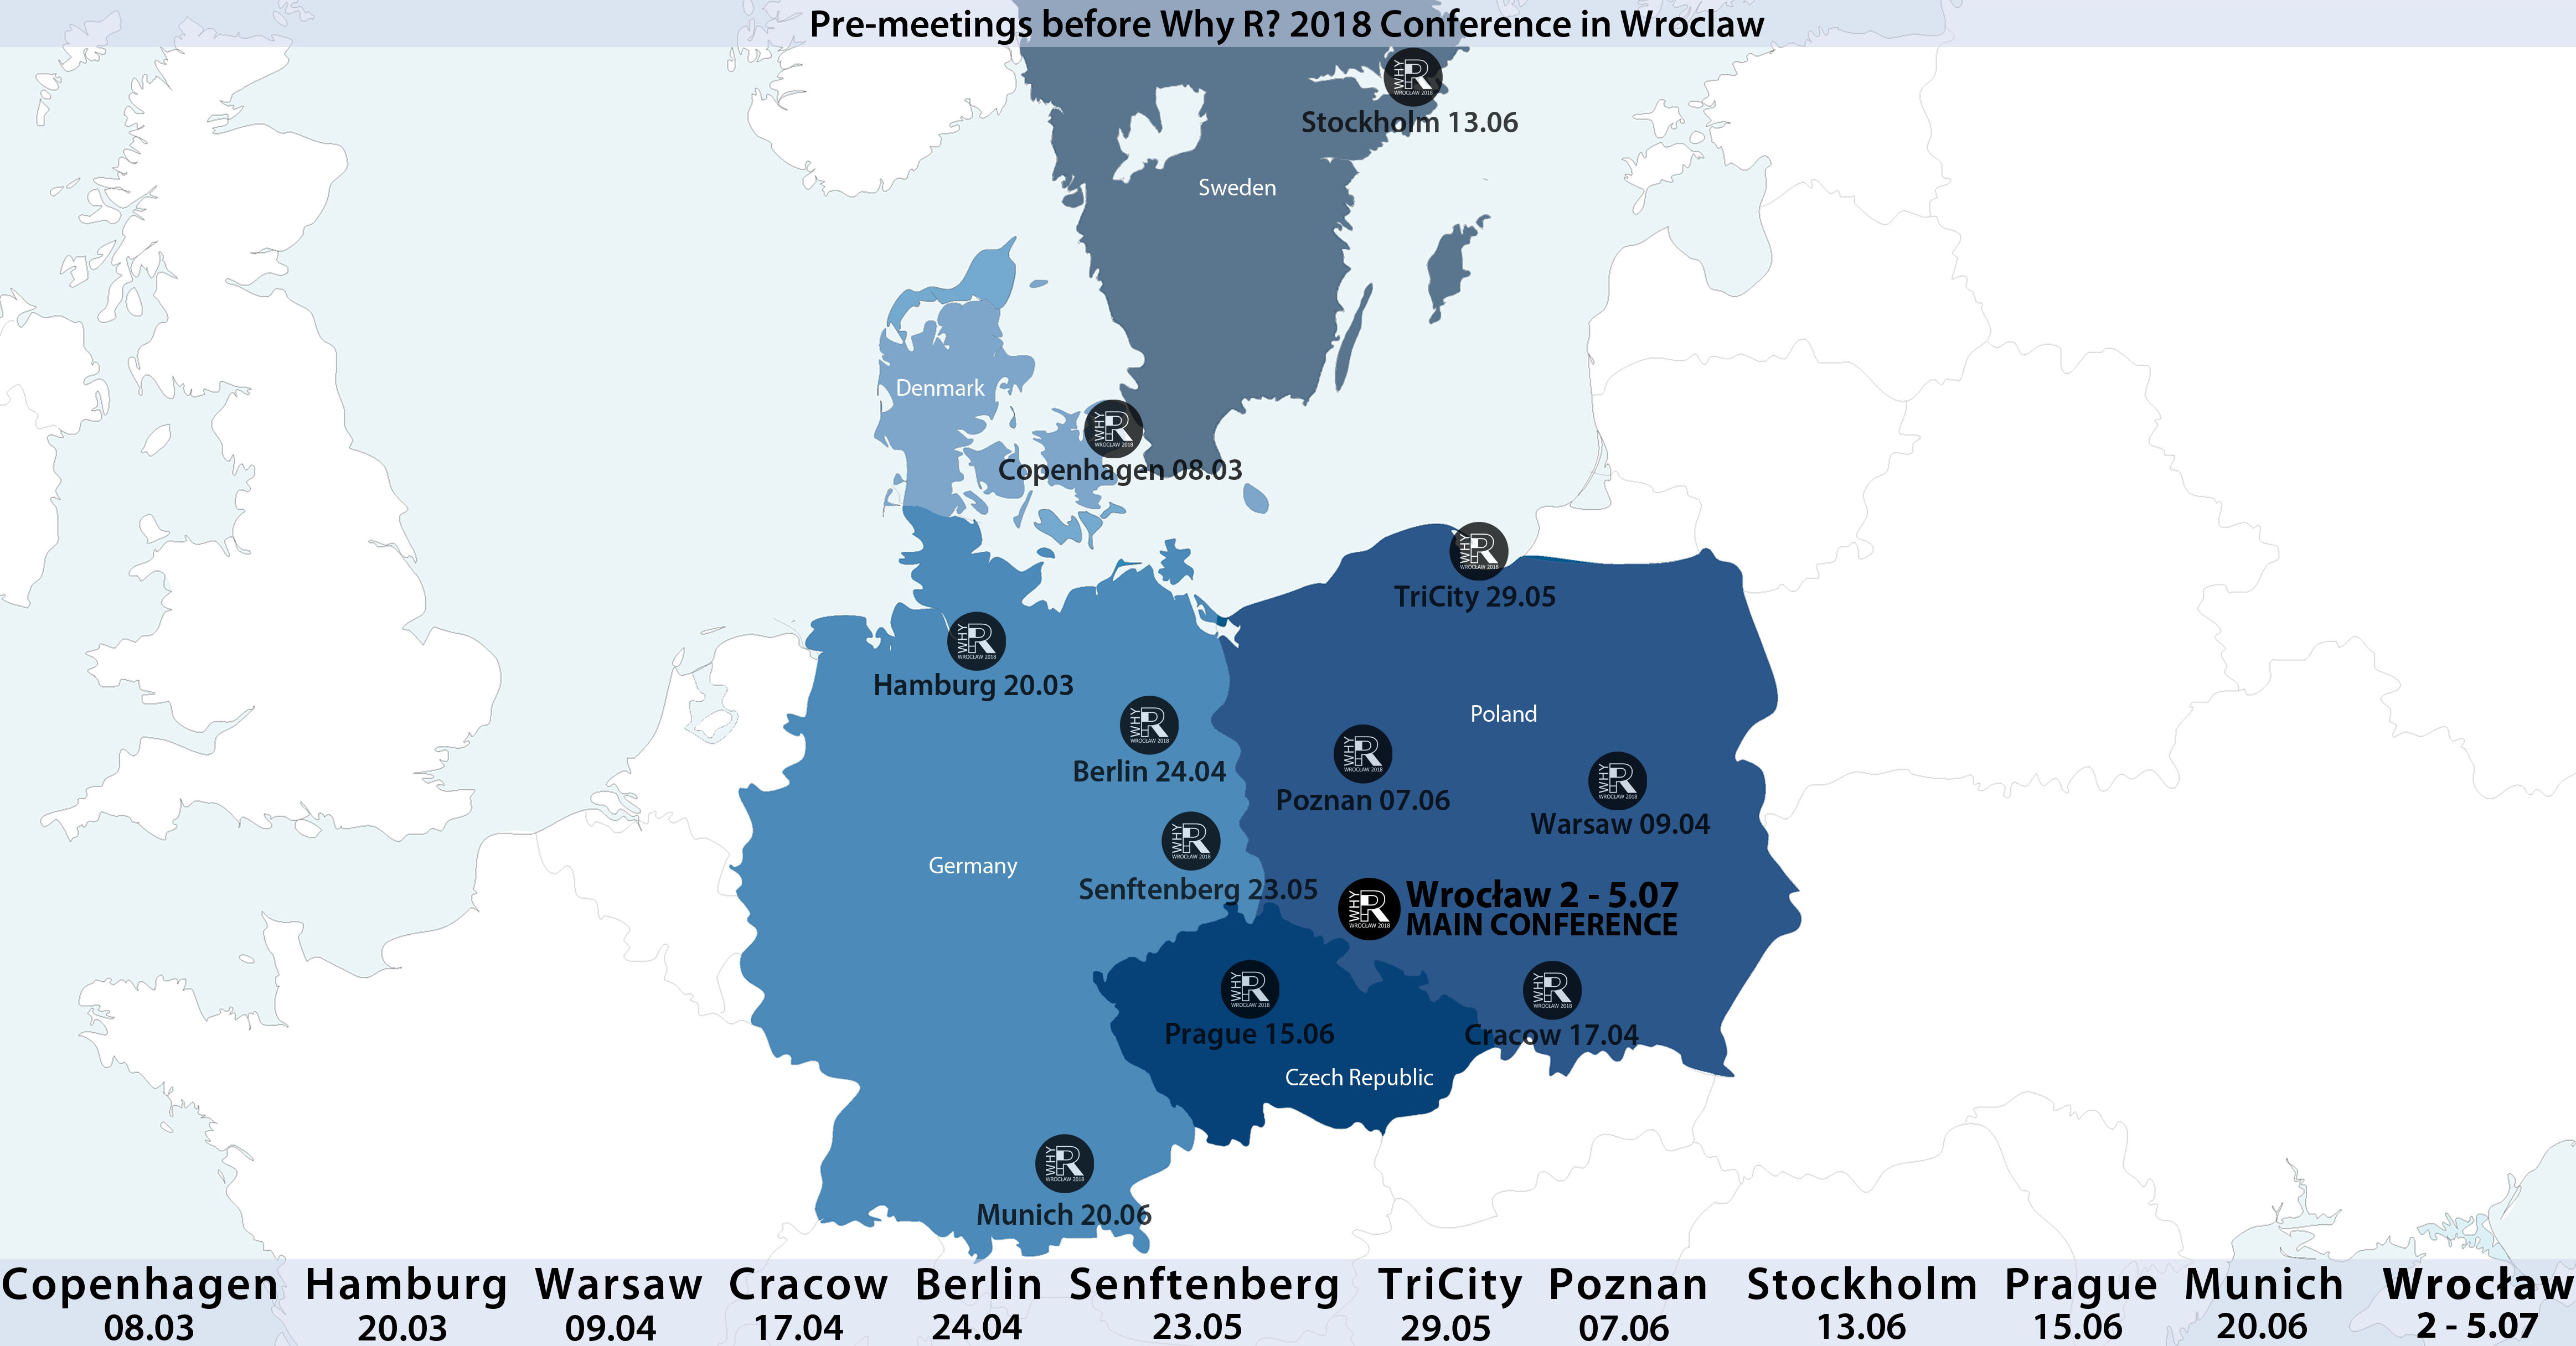
We are pleased to announance upcoming Why R? 2018 conference that is going to happen in central-eastern Europe (Poland, Wroclaw) this July (2-5th). It is the last week for the call for papers! Submit your talk here. About More about the conference one can find on the conference website whyr2018....
[Read more...]

A perfect RStudio layout

May 21, 2018 | Ilya Kashnitsky

Tiny things can separate life into “before” and “after”. Here is one. For almost a year I’ve been daily sending mental “thank you” to Ugo (@ugobas) who showed me how to re-organize panes in RStudio. Since then I’ve been spreading this tiny improvement so many times that I ...
[Read more...]

Competition: WhyR 2018

May 21, 2018 | R on The Jumping Rivers Blog

The competition It’s competition time! We’re sponsoring Why R? 2018 Conference. The conference runs from the 2-5th of July in Wroclaw, Poland and us nice folks here at Jumping Rivers are giving away a free ticket to the conference! The competition To enter your name into the prize ...
[Read more...]

eRum 2018 highlights

May 21, 2018 | Mango Solutions

Aimée Gott, Education Practice Lead I always find it difficult to pick highlights from a conference and the eRum 2018 team did a fantastic job of making it difficult for me once again, so here goes... Day One The first day offered a huge choice in workshops, but teaching one ...
[Read more...]

USL Scalability Modeling with Three Parameters

May 20, 2018 | Neil Gunther

NOTE: Annoyingly, the remote mathjax server often takes it's sweet time rendering LaTex equations (like, up to a minute or more!!!). I don't know if this is deliberate on the part of Google or a bug. It used to be faster. If anyone knows, I'd be interested to hear; especially ...
[Read more...]

Data Viz and Manipulation P2

May 20, 2018 | Analysis of AFL

Using fitzRoy and the tidyverse
library(fitzRoy)
library(tidyverse)
## -- Attaching packages ----------------------- tidyverse 1.2.1 --
## v ggplot2 2.2.1     v purrr   0.2.5
## v tibble  1.4.2     v dplyr   0.7.6
## v tidyr   0.8.1     v stringr 1.3.1
## v readr   1.1.1     v forcats 0.3.0
## -- Conflicts -------------------------- tidyverse_conflicts() --
## x dplyr::filter() masks stats::filter()
## x dplyr::lag()    masks stats::lag()
So what we did before, was we created 3 variables from afltables about Tony Lockett. They were Year (afl season), GM (totals games played in afl season) and GL (total goals kicked in season). These are summary statistics i.e. the year ...
[Read more...]

Data Viz The Glossy

May 20, 2018 | Analysis of AFL

One of the fun things when doing graphs, is that moment when you identify something that sticks out. A great example of this is done by ethan_meldrum In it we can see how much Paul Seedsman 2018 has stood out so far. Lets give it the ggplot/fitzRoy treatment. Step ...
[Read more...]

Safe Disposal of Unexploded WWII Bombs

May 20, 2018 | Theory meets practice...

Abstract Unexploded WWII bombs are ticking threats despite being dropped more than 70 years ago. In this post we explain how statistical methods are used to plan the search and disposal of unexploded WWII bombs. In particular we consider and exemplify the non-parametric nearest neighbour distance (NND) method implemented in the ...
[Read more...]

ML models: What they can’t learn?

May 20, 2018 | smarterpoland

What I love in conferences are the people, that come after your talk and say: It would be cool to add XYZ to your package/method/theorem. After the eRum (great conference by the way) I was lucky to hear from Tal Galili: It would be cool to use DALEX ... [Read more...]

Using RStudio and Git version control

May 20, 2018 | experimentalbehaviour

lIt is fairly easy to link Github or Bitbucket with RStudio, in order to enable version control, or in order to work collectively on a data project, science article, or book. It can also be used to make your data or project publicly accessible (however, there is no guarantee that ...
[Read more...]
1 3 4 5 6 7 16

Never miss an update!
Subscribe to R-bloggers to receive
e-mails with the latest R posts.
(You will not see this message again.)

Click here to close (This popup will not appear again)