March 2018

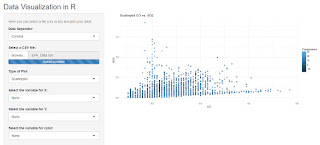
Data Visualization Website with Shiny

March 25, 2018 | Fabio Veronesi

My second Shiny app is dedicated to data visualization.Here users can simply upload any csv or txt file and create several plots:Histograms (with option for faceting) Barchart (with error bars, and option for color with dodging and faceting) BoxPlots (with option for faceting) Scatterplots (with options for color, ...
[Read more...]

The Bull Survived on Friday, but Barely

March 24, 2018 | quintuitive

There are only a few well-known signals which I consider reliable. One of them is the Dow Theory. According to it, or at least to some interpretations of it, the bull market cycle almost ended this Friday. This time I am adding something new. I recorded myself while doing some ... [Read more...]

Storrrify #satRdayCapeTown 2018

March 23, 2018 | Posts on Maëlle's R blog

One week ago I was in Cape Town for the local satRday conference, where I had the honor to be one of the two keynote speakers, the other one being sports analytics extraordinaire Stephanie Kovalchik (You can read Stephanie Kovalchik’s account of the conference in this blog post). It ... [Read more...]

R:case4base – about the series

March 23, 2018 | R Blog

Contents What is does this series offer? What is considered base R? Discuss the article What is does this series offer? This is the introduction to the R:case4base series. The aim of the series is to elaborate on very useful features of base R that are lesser known ... [Read more...]

Storrrify #satRdayCapeTown 2018

March 23, 2018 | Maëlle Salmon

One week ago I was in Cape Town for the local satRday conference, where I had the honor to be one of the two keynote speakers, the other one being sports analytics extraordinaire Stephanie Kovalchik (You can read Stephanie Kovalchik’s account of the conference in this blog post). It ... [Read more...]

Plotting US Metro Area GDP with ggplot

March 23, 2018 | Sharp Sight

It’s clear that there are some economic shifts happening in the world, if not the US itself. In light of this, I decided to do some simple investigation into the economic performance of US cities. This is, by the way, one of the critical reasons to master data science. ...
[Read more...]

Plotting US Metro Area GDP with ggplot

March 23, 2018 | Sharp Sight

It’s clear that there are some economic shifts happening in the world, if not the US itself. In light of this, I decided to do some simple investigation into the economic performance of US cities. This is, by the way, one of the critical reasons to master data science. ... [Read more...]

Diamonds and Faceting are a Data Scientist’s best Friends

March 23, 2018 | Lea Waniek

In the last post of this series, we took a first look at strategies for the effective visualization and exploration of data patterns within large data sets. Namely, we examined ways to overcome overplotting, with a focus on a two-dimensional feature space defined by two continuous features. However, oftentimes we ...
[Read more...]

RcppCNPy 0.2.9

March 22, 2018 | Thinking inside the box

Another minor maintenance release of the RcppCNPy package arrived on CRAN this evening. RcppCNPy provides R with read and write access to NumPy files thanks to the cnpy library by Carl Rogers. There is only small code change: a path is now checked be... [Read more...]

The most prolific package maintainers on CRAN

March 22, 2018 | David Smith

During a discussion with some other members of the R Consortium, the question came up: who maintains the most packages on CRAN? DataCamp maintains a list of most active maintainers by downloads, but in this case we were interested in the total number of packages by maintainer. Fortunately, this is ... [Read more...]
1 3 4 5 6 7 15

Never miss an update!
Subscribe to R-bloggers to receive
e-mails with the latest R posts.
(You will not see this message again.)

Click here to close (This popup will not appear again)