December 2017

New R Course: Introduction to the Tidyverse!

December 12, 2017 | gabriel

Hi! Big announcement today as we just launched Introduction to the Tidyverse R course by David Robinson! This is an introduction to the programming language R, focused on a powerful set of tools known as the “tidyverse”. In the course you’ll learn the intertwined processes of data manipulation and ...
[Read more...]

Be a BigBallR in #rstats : Stayeth or Switcheth

December 12, 2017 | MikeJackTzen

If you’re a Big Baller, you know when to stayeth in your lane but also when to switcheth lanes. The Big Baller Brand brothers just inked a deal to play professional basketball in Europe. They switched into a different lane to achieve their original goal. The knee-jerk reaction from ... [Read more...]

When a Tweet Turns Into an R Package

December 12, 2017 | Mango Solutions

Reproduced with the kind permission of our Head of Data Engineering, Mark Sellors and first published on his blog When a Tweet Turns Into an R Package Boy, that escalated quickly I just wanted to write up a brief post about the power of R, its community, and tell the ... [Read more...]

Point Pattern Analysis using Ecological Methods in R

December 12, 2017 | James

Here is a quick example for how to get started with some of the more sophisticated point pattern analysis tools that have been developed for ecologists – principally the adehabitathr package – but that are very useful for human data. Ecologists deploy point pattern analysis to establish the “home range” of a ... [Read more...]

A Not So Simple Bar Plot Example Using ggplot2

December 12, 2017 | INWT-Blog-RBloggers

This is a reproduction of the (simple) bar plot of chapter 6.1.1 in Datendesign mit R with ggplot2. To download the data you can use the following lines: dir.create("data") writeLines("*", "data/.gitignore") download.file("http://www.datendesign-r.de/alle_daten.zip", "data/alle_daten.zip") unzip("data/alle_daten....
[Read more...]

Stock-Recruitment Graphing Questions

December 12, 2017 | fishR Blog

A fishR user recently asked me In the book that you published, I frequently use the stock-recruit curve code. The interface that shows both the Ricker/Beverton-Holt figure with the recruit per spawner to spawner figure (i.e., the dynamic ... [Read more...]

Explaining Predictions of Machine Learning Models with LIME – Münster Data Science Meetup

December 11, 2017 | Dr. Shirin Glander

Slides from Münster Data Science Meetup These are my slides from the Münster Data Science Meetup on December 12th, 2017. My sketchnotes were collected from these two podcasts: https://twimlai.com/twiml-talk-7-carlos-guestrin-explaining-predictions-machine-learning-models/ https://dataskeptic.com/blog/episodes/2016/trusting-machine-learning-models-with-lime Sketchnotes: TWiML Talk #7 with Carlos Guestrin – Explaining the Predictions of ... [Read more...]

Random walking

December 11, 2017 | dan

BAGEL SHOP IDEA I was sitting in a bagel shop on Saturday with my 9 year old daughter. We had brought along hexagonal graph paper and a six sided die. We decided that we would choose a hexagon in the middle of the page and then roll the die to determine ... [Read more...]

Linear mixed-effect models in R

December 11, 2017 | Francisco Lima

Statistical models generally assume that All observations are independent from each other The distribution of the residuals follows , irrespective of the values taken by the dependent variable y When any of the two is not observed, more sophisticated modelling approaches are necessary. Let’s consider two hypothetical problems that violate ...
[Read more...]

Vectorize Fuzzy Matching

December 11, 2017 | Andrew Treadway

One of the best things about R is its ability to vectorize code. This allows you to run code much faster than you would if you were using a for or while loop. In this post, we’re going to show you how to use vectorization to speed up fuzzy ...
[Read more...]

Tennis Grand Slam Tournaments Champions Basic Analysis

December 11, 2017 | Giorgio Garziano

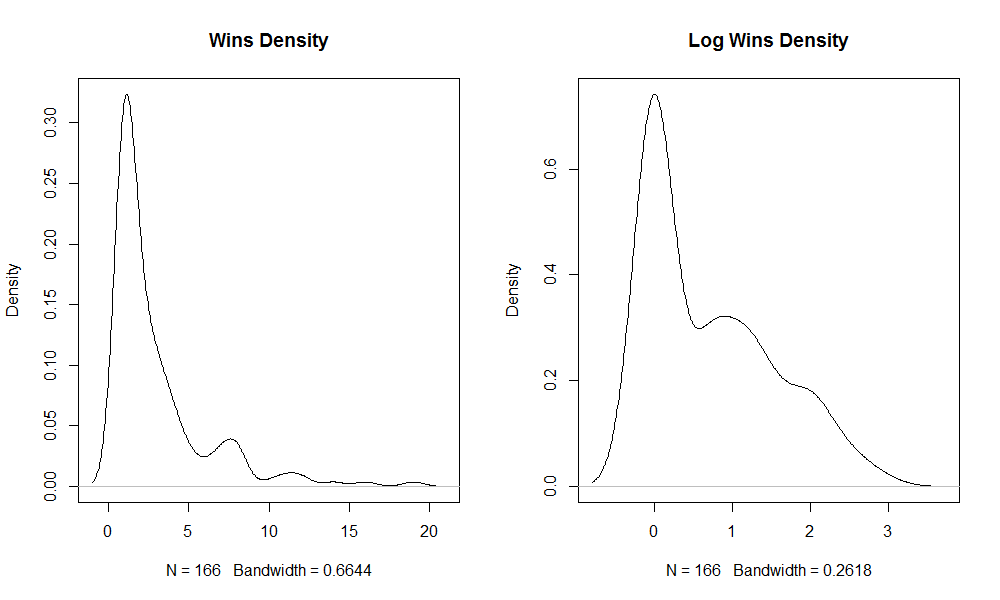
The present tutorial analyses the Tennis Grand Slam tournaments main results from the statistical point of view. Specifically, I try to answer the following questions: – How to fit the distribution of the Grand Slam tournaments number of victories across players? – How to compute the probability of having player’s victories ...
[Read more...]
1 7 8 9 10 11 13

Never miss an update!
Subscribe to R-bloggers to receive
e-mails with the latest R posts.
(You will not see this message again.)

Click here to close (This popup will not appear again)