December 2017

Getting started with seplyr

December 14, 2017 | John Mount

A big “thank you!!!” to Microsoft for hosting our new introduction to seplyr. If you are working R and big data I think the seplyr package can be a valuable tool. For how and why, please check out our new introductory article.
[Read more...]

Pipes in R Tutorial For Beginners

December 14, 2017 | gabriel

You might have already seen or used the pipe operator when you're working with packages such as dplyr, magrittr,… But do you know where pipes and the famous %__% operator come from, what they exactly are, or how, when and why you should use them? Can you also come up with ...
[Read more...]

An introduction to seplyr

December 14, 2017 | Guest Blogger

by John Mount, Win-Vector LLC [`seplyr`](https://winvector.github.io/seplyr/) is an [`R`](https://www.r-project.org) package that supplies improved standard evaluation interfaces for many common data wrangling tasks. The core of `seplyr` is a re-skinning of [`dplyr`](https://CRAN.R-project.org/package=dplyr)'s functionality to `seplyr` ... [Read more...]

Comparing smooths in factor-smooth interactions II

December 14, 2017 | Gavin L. Simpson

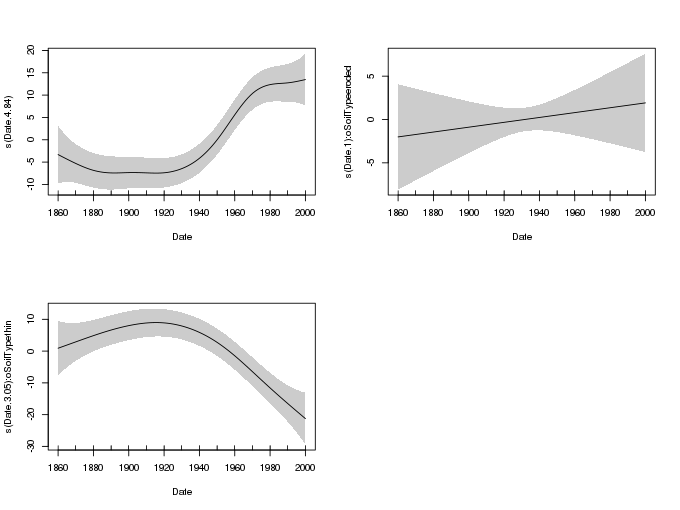
In a previous post I looked at an approach for computing the differences between smooths estimated as part of a factor-smooth interaction using s()’s by argument. When a common-or-garden factor variable is passed to by, gam() estimates a separate smooth for each level of the by factor. Using the (...
[Read more...]

archivist: Boost the reproducibility of your research

December 14, 2017 | smarterpoland

A few days ago Journal of Statistical Software has published our article (in collaboration with Marcin Kosiński) archivist: An R Package for Managing, Recording and Restoring Data Analysis Results. Why should you care? Let’s see. Starter Would you want to retrieve a ggplot2 object with the plot on ... [Read more...]

RVowpalWabbit 0.0.10

December 13, 2017 | Thinking inside the box

A boring little RVowpalWabbit package update to version 0.0.10 came in response to another CRAN request: We were switching directories to run tests (or examples) which is now discouraged, so we no longer do this as it turns that we can of course refe... [Read more...]

ggplot2: Line Graphs

December 13, 2017 | Rsquared Academy Blog - Explore Discover Learn

Introduction This is the 8th post in the series Elegant Data Visualization with ggplot2. In the previous post, we learnt to build scatter plots. In this post, we will learn to: build simple line chart grouped line chart map aesthetics to variables modify line color type size Libraries, Code & Data ...
[Read more...]

Team Rtus wins Munich Re Datathon with mlr

December 13, 2017 | Jann Goschenhofer

Blog Post “Rtus @ Munich Re Datathon” On the weekend of November 17. - 19. five brave data-knights from team “Rtus and the knights of the data.table” took on the challenge to compete in a datathon organized by Munich Re in its Munich-based innovation lab. Team Rtus was formed in April this ...
[Read more...]

R in the Windows Subsystem for Linux

December 13, 2017 | David Smith

R has been available for Windows since the very beginning, but if you have a Windows machine and want to use R within a Linux ecosystem, that's easy to do with the new Fall Creator's Update (version 1709). If you need access to the gcc toolchain for building R packages, or ... [Read more...]

Color palettes derived from the Dutch masters

December 13, 2017 | That’s so Random

Among tulip fields, canals and sampling cheese, the museums of the Netherlands are one of its biggest tourist attractions. And for very good reasons! During the seventeenth century, known as the Dutch Golden Age, there was an abundance of talented painters. If you ever have the chance to visit the ...
[Read more...]

Mapping oil production by country in R

December 13, 2017 | Sharp Sight

This week, here's another map: a map of world oil production that you can create using R. As I've mentioned, projects like this – a few hundred lines of code, with a variety of functions from the tidyverse – are excellent practice for intermediate data scientists. The post Mapping oil production by ... [Read more...]

Introduction to Skewness

December 12, 2017 | R Views

In previous posts here, here, and here, we spent quite a bit of time on portfolio volatility, using the standard deviation of returns as a proxy for volatility. Today we will begin to a two-part series on additional statistics that aid our understanding of return dispersion: skewness and kurtosis. Beyond ...
[Read more...]

A minimal Project Tree in R

December 12, 2017 | mareviv

You can also check this post, written in #blogdown, here: minimal-project-tree-r. Introduction The last two days arrived at my twitter feed some discussions on how bad are the following sentences at the beginning of your R script/notebook, sparked by @JennyBryan’s … Sigue leyendo →
[Read more...]

A chart of Bechdel Test scores

December 12, 2017 | David Smith

A movie is said to satisfy the Bechdel Test if it satisfies the following three criteria: The movie has at least two named female characters ... who have a conversation with each other ... about something other than a man The website BechdelTest.com scores movies accordingly, granting one point for each ... [Read more...]
1 6 7 8 9 10 13

Never miss an update!
Subscribe to R-bloggers to receive
e-mails with the latest R posts.
(You will not see this message again.)

Click here to close (This popup will not appear again)