May 2017

Overdispersion tests in #rstats

May 3, 2017 | lortie

A brief note on overdispersion Assumptions Poisson distribution assume variance is equal to the mean. Quasi-poisson model assumes variance is a linear function of mean. Negative binomial model assumes variance is a quadratic function of the mean. rstats implementation #to test you need to fit a poisson GLM then apply ... [Read more...]

Data Science for Operational Excellence (Part-5)

May 3, 2017 | Lauro Silva

Operations need to have demand forecasts in order to establish optimal resource allocation policies. But, when we make predictions the only thing that we assure is the occurrence of prediction errors. Fortunately, there is no need to be 100% accurate to succeed, we just need to perform better than our competitors. ... [Read more...]

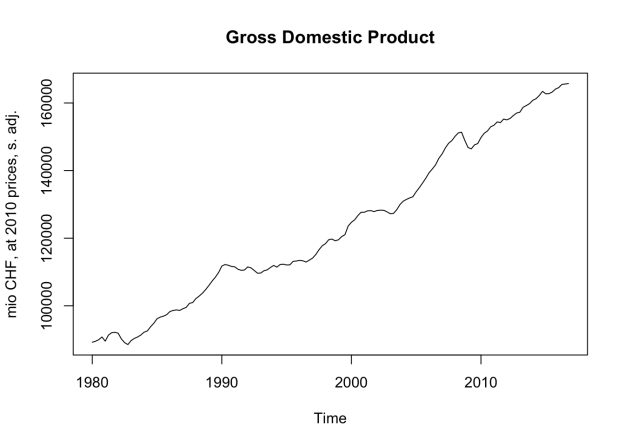
Forecasting GDP with R and dataseries.org

May 3, 2017 | usefulr

The website dataseries.org aims to be Switzerland’s FRED – a free comprehensive database of Swiss time series. Powered by R and written in Shiny (also using a bit of JavaScript) it allows you to quickly search and explore a large number of data series. Switzerland’s time series in ...
[Read more...]

Text Analysis R Developers’ Workshop 2017

May 3, 2017 | Ken Benoit

On 21-22 April, the London School of Economics hosted the Text Analysis Package Developers' Workshop, a two-day event held in London that brought together developers of R packages for working with text and text-related data. This included a wide range of applications, including string handling (stringi) and tokenization (the rOpenSci-onboarded ... [Read more...]

Monthly seasonality

May 2, 2017 | R on Rob J Hyndman

I regularly get asked why I don’t consider monthly seasonality in my models for daily or sub-daily time series. For example, this recent comment on my post on seasonal periods, or this comment on my post on daily data. The fact is, I’ve never seen a time series ... [Read more...]

Shiny in Medicine

May 2, 2017 | R Views

Shiny Apps are becoming ubiquitous as a way for data scientists to present the results of an analysis, and also to engage with information consumers who may not be coders. The trend I see is that the greater the variety of skills and interests of the information consumers for any ...
[Read more...]

Monthly seasonality

May 2, 2017 | R on Rob J Hyndman

I regularly get asked why I don’t consider monthly seasonality in my models for daily or sub-daily time series. For example, this recent comment on my post on seasonal periods, or this comment on my post on daily data. The fact is, I’ve never seen a time series ... [Read more...]

Le Monde puzzle [#1006]

May 2, 2017 | xi'an

Once the pseudo-story [noise] removed, a linear programming Le Monde mathematical puzzle: For the integer linear programming problem max 2x¹+2x²+x³+…+x¹⁰ under the constraints x¹__x²+x³, x²__x³+x⁴, …, x⁹__x¹⁰+x¹, x¹⁰__x¹+x² find a solution with the maximal number of positive entries. Expressed this ...
[Read more...]

Why to use wrapr::let()

May 2, 2017 | John Mount

I have written about referential transparency before. In this article I would like to discuss “leaky abstractions” and why wrapr::let() supplies a useful (but leaky) abstraction for R programmers. Abstractions A common definition of an abstraction is (from the OSX dictionary): the process of considering something independently of its ...
[Read more...]

Forecasting for small business Exercises (Part-4)

May 2, 2017 | Guillaume Touzin

Uncertainty is the biggest enemy of a profitable business. That is especially true of small business who don’t have enough resources to survive an unexpected diminution of revenue or to capitalize on a sudden increase of demand. In this context, it is especially important to be able to predict ... [Read more...]

The Datasaurus Dozen

May 2, 2017 | David Smith

There's a reason why data scientists spend so much time exploring data using graphics. Relying only on data summaries like means, variances, and correlations can be dangerous, because wildly different data sets can give similar results. This is a principle that has been demonstrated in statistics classes for decades with ... [Read more...]

The making of datasauRus

May 2, 2017 | Steph

Around 8:30pm I saw this tweet and duly retweeted https://t.co/WuyU9D6npK — Richie Cotton (@richierocks) May 1, 2017 It turns out awesome folks, George and Justin, had made a process whereby they can generate different distributions of The post The making of datasauRus appeared first on Locke Data. Locke ... [Read more...]

Figure Aesthetics or Overlays?

May 2, 2017 | Tony Hirst

Tinkering with a new chart type over the weekend, I spotted something rather odd in in my F1 track history charts – what look to be outliers in the form of cars that hadn’t been lapped on that lap appearing behind the lap leader of the next lap, on track. ...
[Read more...]

Getting started with data science – recommended resources

May 2, 2017 | Steph

An oft asked question is what resources can I recommend for getting started with data science? Here are my recommendations, and if you have others, please put them in the comments! NB Links in this post may be affiliate links The post Getting started with data science – recommended resources appeared ... [Read more...]
1 14 15 16 17 18

Never miss an update!
Subscribe to R-bloggers to receive
e-mails with the latest R posts.
(You will not see this message again.)

Click here to close (This popup will not appear again)