September 2016

Fitting a distribution in Stan from scratch

September 27, 2016 | R on mages' blog

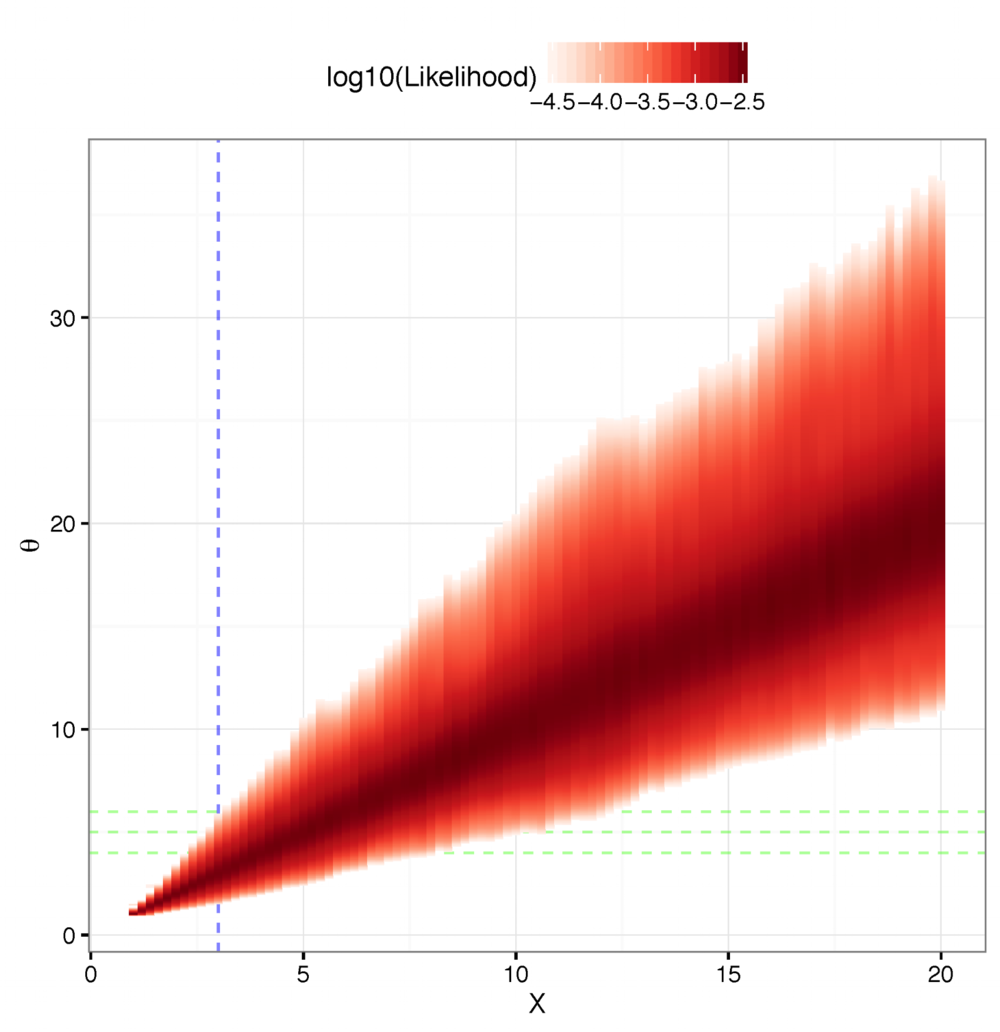
Last week the French National Institute of Health and Medical Research (Inserm) organised with the Stan Group a training programme on Bayesian Inference with Stan for Pharmacometrics in Paris. Daniel Lee and Michael Betancourt, who run the course over three days, are not only members of Stan’s development team, ... [Read more...]

Heart-shaped wordcloud, celebrating Colombia peace treaty

September 26, 2016 | Amit

This is a lightening quick post just providing the script to draw a heart-shaped wordcloud, using the awesome wordcloud2 package. See the resulting image here:   Apparently, the original code allows you to fit a wordcloud to any shape, even custom shapes, but I didn’t find that functionality pushed out ... [Read more...]

2016 UK Tour

September 26, 2016 | Max Kuhn

I'll be in the UK next week doing three talks in three days: First, I'll be giving a talk at the London R-Ladies meetup on Monday October 3rd with perhaps the best title yet: Whose Scat Is That? An 'Easil...
[Read more...]

DataCamp Course

September 26, 2016 | Max Kuhn

Zachary Deane-Mayer, who collaborates on caret, has put together a DataCamp course on Machine Learning in R. Zach and DataCamp did a great job of developing a course that is just right for people who are ...
[Read more...]

Introduction to BiclustGUI

September 26, 2016 | BiclustGUI - r

BiclustGUI in R Ewoud De Troyer, University of Hasselt (CenStat) Biclustering in a GUI & Growing a GUI together! Introduction We are happy to announce the first release of the BiclustGUI on CRAN (RcmdrPlugin.BiclustGUI)! This GUI will you enable... [Read more...]

Upgrading to plotly 4.0 (and above)

September 26, 2016 | modern.data

By Carson Sievert, lead Plotly R developer I’m excited to announce that plotly’s R package just sent its first CRAN update in nearly four months. To install the update, run install.packages("plotly"). This update has breaking changes, enables new features, fixes numerous bugs, and takes us from ... [Read more...]

Replicating Plots – Boxplot Exercises

September 26, 2016 | karolis koncevicius

R’s boxplot function has a lot of useful parameters allowing us to change the behaviour and appearance of the boxplot graphs. In this exercise we will try to use those parameters in order to replicate the visual style of Matlab’s boxplot. Before trying out this exercise please make ... [Read more...]

Machine Learning for Drug Adverse Event Discovery

September 26, 2016 | Fisseha Berhane

We can use unsupervised machine learning to identify which drugs are associated with which adverse events. Specifically, machine learning can help us to create clusters based on gender, age, outcome of adverse event, route drug was administered, purpose the drug was used for, body mass index, etc. This can help ... [Read more...]

I Hate You paste!

September 25, 2016 | R-SquareD

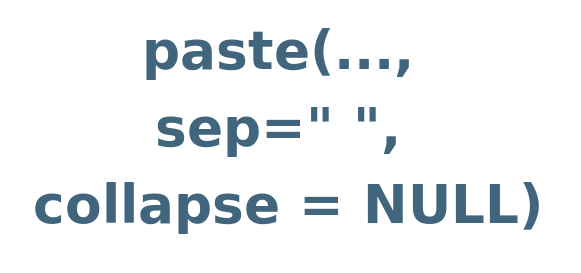
Don't call me anymore. - I really don’t hate the paste function, it is actually quite useful when working with vectors. I just hate using it for simple string concatenation. var = 4.345 paste0("The value is: ", var) ## [1] "...
[Read more...]

Better Model Selection for Evolving Models

September 25, 2016 | quintuitive

For quite some time now I have been using R’s caret package to choose the model for forecasting time series data. The approach is satisfactory as long as the model is not an evolving model (i.e. is not re-trained), or if it evolves rarely. If the model is ... [Read more...]

Song Lyrics Across the United States

September 25, 2016 | Julia Silge

The inspiration for this post is a joint venture by both me and my husband, and its genesis lies more than 15 years in our past. One of the recurring conversations we have in our relationship (all long-term relationships have these, right?!) is about song lyrics and place names. I think ... [Read more...]

The biggest liars in US politics

September 25, 2016 | tlfvincent

Anyone that follows US politics will be aware of the tremendous changes and volatility that has struck the US political landscape in the past year. In this post, I leverage third-party data to surface who are the most frequent liars, and show how to build a containerized Shiny app to ... [Read more...]

FileTable and storing graphs from Microsoft R Server

September 25, 2016 | tomaztsql

FileTable has been around now for quite some time and and it is useful  for storing files, documents, pictures and and binary files in a designated SQL Server table – FileTable. The best part of FileTable is the fact one can access it from windows or other application as if it ...
[Read more...]
1 2 3 4 5 13

Never miss an update!
Subscribe to R-bloggers to receive
e-mails with the latest R posts.
(You will not see this message again.)

Click here to close (This popup will not appear again)