September 2016

tint 0.0.1: Tint Is Not Tufte

September 24, 2016 | Thinking inside the box

A new experimental package is now on the ghrr drat. It is named tint which stands for Tint Is Not Tufte. It provides an alternative for Tufte-style html presentation. I wrote a bit more on the package page and the README in the repo -- so go read thi... [Read more...]

Monetizing R Portfolios

September 24, 2016 | Ari Lamstein

I recently ran an office hours on the topic of building R Portfolios. The conversation was fascinating to me. One issue that came up was monetization.... The post Monetizing R Portfolios appeared first on AriLamstein.com. [Read more...]

Radial Stacked Area Chart in R using Plotly

September 24, 2016 | Riddhiman

In this post we’ll quickly show how to create radial stacked ara charts in plotly. We’ll use the AirPassengers dataset. Inspired by Mike Bostocks post: http://bl.ocks.org/mbostock/3048740 [crayon-57e6a72085a64536913742/] Radial Stacked Area Chart [Read more...]

My first Shiny App: control charts

September 24, 2016 | Mic

After having carefully followed the online official Shiny tutorial, I decided to make a quick try at making my very first Shiny App. I should say that I found myself very well with the explanation given and Shiny was definitely one of the libraries tha...
[Read more...]

Date Wrangling with dplyr and lubridate

September 23, 2016 | R-SquareD

Converting data.frames to different periods - When I’m working with financial time series data, I usually use xts objects. I convert the data to a data.frame when I’m ready to plot. Sometimes, I find that I want to adjust the ... [Read more...]

Visualization with R: Time plots #rstats

September 23, 2016 | Liang-Cheng Zhang

R is a great tool to visualize your data: it is free to use and has lots packages to make beautiful plots. In this post, we gonna teach you how to make time plots to visualize stock returns with data from Yahoo finance. For those not familiar with how to ...
[Read more...]

Advanced Base Graphics Exercises

September 23, 2016 | Francisco Méndez

Being able to visualize information through plots is essential for a statistic analysis. A simple and clean graph  can explain much more than words.  In this set of exercises you will test and learn advanced graphic arguments. Before you start check the documentation for the following functions: plot, points, abline, ... [Read more...]

Microsoft R at the EARL Conference

September 23, 2016 | David Smith

Slides have now been posted for many of the talks given at the recent Effective Applications of the R Language (London) conference, and I thought I'd highlight a few that featured Microsoft R. Chris Cole manages the deployment of R at Investec, supporting investment and risk teams worldwide. Despite some ... [Read more...]

Importing Data into R

September 23, 2016 | wszafranski

One of the most important features we need to be able to do in R is import existing data, whether it be .txt files, .csv files, or even .xls (Excel files). If we can’t import data into R, then we can’t do anything. Okay let’s get started. ...
[Read more...]

EARL London 2016 revisited – Day 1

September 23, 2016 | Mango Blogger

This year’s EARL conference in London was another huge success. In this blogpost we revisit some of the presentations from Day 1. In stream 1 the conference started off with a presentation about recommender systems at the Telegraph by Magda … Continue reading → [Read more...]

Correspondence Analysis in Tableau with R

September 23, 2016 | Bora Beran

Correspondence analysis is an exploratory data analysis method for discovering relationships between two or more categorical variables. It is very often used for visualizing survey data since if the matrix is large enough (which could be due to large number of variables but also possible with small number of variables ...
[Read more...]

an inverse permutation test

September 22, 2016 | xi'an

A straightforward but probabilistic riddle this week in the Riddler, which is to find the expected order of integer i when the sequence {1,2,…,n} is partitioned at random into two sets, A and B, each of which is then sorted before both sets are merged. For instance, if {1,2,3,4} is divided ...
[Read more...]

Size of XDF files using RevoScaleR package

September 22, 2016 | tomaztsql

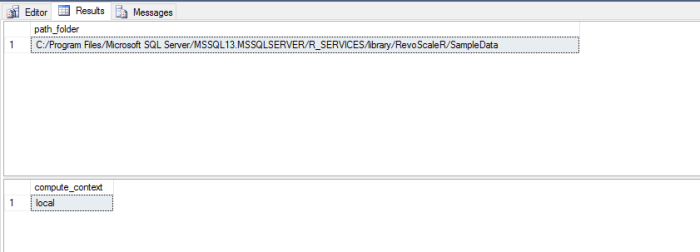
It came to my attention that size of XDF (external data frame) file can change drastically based on the compute context and environment. When testing the output of a dataset I was working on in SQL Server Management Studio I was simultaneously testing R code in RTVS or  R Studio ...
[Read more...]

How to choose the right tool for your data science project

September 22, 2016 | Guest Blogger

by Brandon Rohrer, Principal Data Scientist, Microsoft R or Python? Torch or TensorFlow? (or MXNet or CNTK)? Spark or map-reduce? When we're getting started on a project, the mountain of tools to choose from can be overwhelming. Sometimes it makes me feel small and bewildered, like Alice in Wonderland. Luckily, ... [Read more...]
1 2 3 4 5 6 13

Never miss an update!
Subscribe to R-bloggers to receive
e-mails with the latest R posts.
(You will not see this message again.)

Click here to close (This popup will not appear again)