R Courses – Autumn Term Calendar
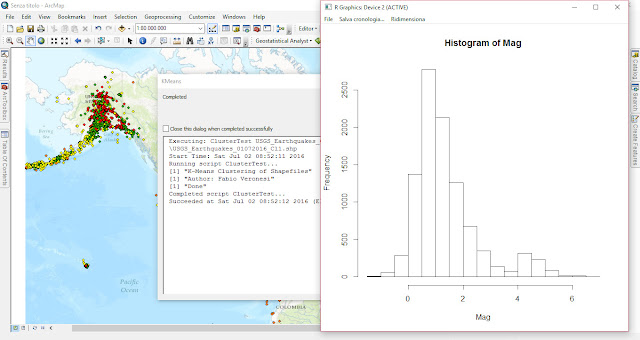
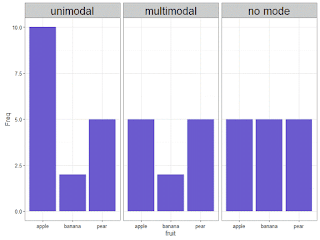
Info, dates and topics of our five Autumn R Courses: from programming to data manipulation, from statistics to data mining, everything with R.
The post R Courses - Autumn Term Calendar appeared first on MilanoR. [Read more...]