June 2016

Analyzing Public Health Data in R

June 20, 2016 | Thomas Yokota

Today’s post is by Thomas Yokota, an epidemiologist in Hawaii. I’ve been corresponding with Thomas via email and telephone for a while. I asked Thomas if he could write an introduction to how R, mapping and open data are used in the public health community. This is his ...
[Read more...]

A Call to Arms[list] Data Analysis!

June 19, 2016 | hrbrmstr

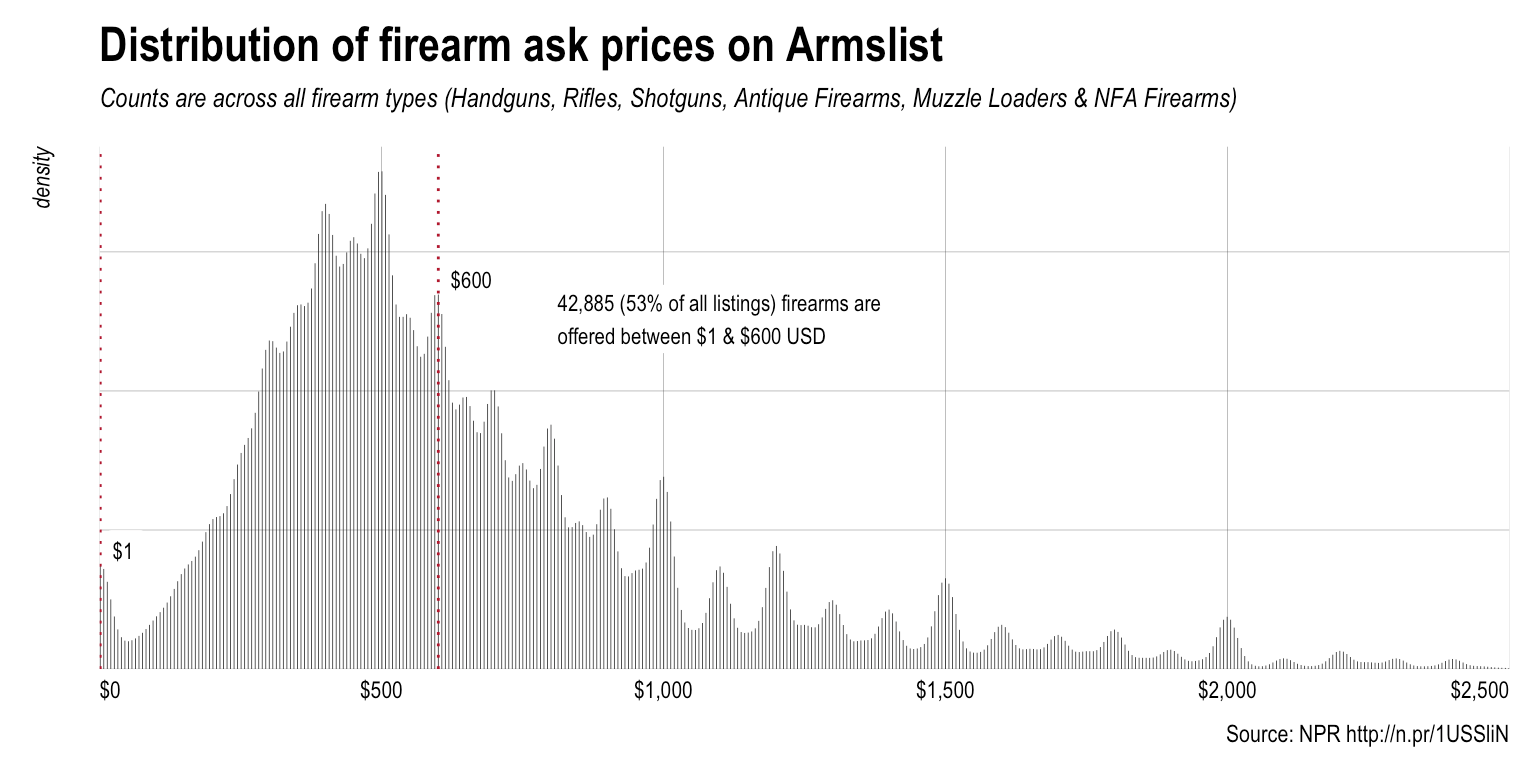
The NPR vis team contributed to a recent story about Armslist, a “craigslist for guns”. Now, I’m neither pro-“gun” or anti-“gun” since this subject, like most heated ones, has more than two sides. What I am is pro-data, and the U.S. Congress is so deep in ...
[Read more...]

Importing CSV data using T-SQL and R

June 18, 2016 | R on Guangchuang Yu

Several ways exists to import CSV (excel) data into your SQL Server Database. One is of course, using SSIS. The other one – similar to SSIS – is using import/export function in SSMS. With wizard, you will be able to import data. Futher on, BULK INSERT (BCP) statement is to all ...
[Read more...]

A web interface for regression analysis: Walkthrough

June 18, 2016 | Ant Guillot

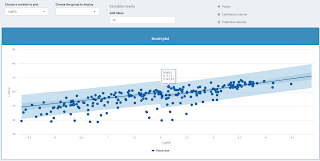
After the quick overview, here is a quick walkthrough to some categorical analysis.Open the app: Here1. Import the data:Here are some homemade data, done with the following R code: set.seed(3467)x=1:400+rnorm(400,0,1)y1=x*2.5+40+rnorm(400,0,50)y2=x*4.5+80+rnorm(400,0,50)group=rep(c('G1','G2'),each=400)x=...
[Read more...]

Princes Disguised in Uniforms

June 18, 2016 | Theory meets practice...

This work is licensed under a Creative Commons Attribution-ShareAlike 4.0 International License. The markdown+Rknitr source code of this blog is available under a GNU General Public License (GPL v3) license from . Abstract We revisit the secretary problem as a mathematical fairy tale: Princes wooing a princess sequentially arrive each having ...
[Read more...]

A web interface for regression analysis: Overview

June 18, 2016 | Ant Guillot

A Web interface for regression analysis (aka WIfRA) 1.What is it ?Firstly, it was supposed to be a project to learn Shiny and quickly turn into a real project. I wanted to bring data visualisation, regression analysis technique and data engineering to everybody and for no-cost. Basically, this is a ...
[Read more...]

PSA: R’s rnorm() and mvrnorm() use different spreads

June 17, 2016 | civilstat

Quick public service announcement for my fellow R nerds: R has two commonly-used random-Normal generators: rnorm and MASS::mvrnorm. I was foolish and assumed that their parameterizations were equivalent when you’re generating univariate data. But nope: Base R can generate univariate … Continue reading → [Read more...]

Data Journalism Awards Data Visualization of the Year, 2016

June 17, 2016 | David Smith

Congratulations to Peter Aldhous and Charles Seife of Buzzfeed News, winners of the 2016 Data Journalism Award for Data Visualization of the Year. They were recognized by their reporting for Spies in the Sky, which analyzed FAA air traffic records to visulize the domestic surveillance activities of the US government. Aldhouse ... [Read more...]

Introducing xda: R package for exploratory data analysis

June 17, 2016 | ujjwalkarn

This R package contains several tools to perform initial exploratory analysis on any input dataset. It includes custom functions for plotting the data as well as performing different kinds of analyses such as univariate, bivariate and multivariate investigation which is the first step of any predictive modeling pipeline. This package ...
[Read more...]

Summary Statistics With Aggregate()

June 16, 2016 | John Akwei

The aggregate() function subsets dataframes, and time series data, then computes summary statistics. The structure of the aggregate() function is aggregate(x, by, FUN). Answers to the exercises are available here. Exercise 1 Aggregate the “airquality” data by “airquality$Month“, returning means on each of the numeric variables. Also, remove “NA” ... [Read more...]
1 4 5 6 7 8 13

Never miss an update!
Subscribe to R-bloggers to receive
e-mails with the latest R posts.
(You will not see this message again.)

Click here to close (This popup will not appear again)